Author: Eric Gilliam
Cause and effect are two sides of the same fact
- Ralph Waldo Emerson
If a narrative fits cleanly in a person’s mind, they have a tendency to believe it a little too easily. The ‘diploma divide’ might be one of these narratives.
The ‘diploma divide’ describes the phenomenon of Trump’s favorability among non-college educated, white voters. The divide is clear. Non-college educated, white voters heavily favored Trump. Several news outlets used voters’ levels of education as the framework to understand the 2016 voting patterns. The Atlantic described the phenomenon as one of the “most powerful forces shaping American politics for decades to come.” The Wall Street Journal published a piece titled, “The New Divide in Politics: Education,” citing Bill McInturff, a Republican pollster, saying, “The new cultural divide is education.”
These articles used education as a framework through which to understand voting patterns. In doing so, many readers have taken their arguments to be causal: Being less educated causes people to vote for Trump. For example, in the comments section of the WSJ article, readers commented things like the following:
It’s simple. People who have been reformed by fine education and sound understanding have better information processing capabilities than those who do not.
Going to college makes you less racist. Racists voted for Trump candidates in 2018, non-racists voted Democrat.
The readers’ assumption that education is a causal factor is understandable. The articles posit education as the framework which explains voting patterns without mentioning other reasonable frameworks which could be used to explain these patterns. However, the failure to examine alternative hypotheses does not mean that there are none.
The accounts in the articles were accepted because the narrative seemed to make sense. Even Trump likely believes the narrative. He touted it on the campaign trail, “I love the poorly educated!” However, using the Gallup poll data one can see that there are other factors that are also predictive of how counties would vote. For example, a county’s average body mass index is about as predictive as its education levels in predicting 2016 election outcomes.
The data call into question the simplicity of the ‘diploma divide’ being the decider of how a county votes. Analysis of the data shows that geography is also a viable framework to understand Trump voting.
The type of city one lives in, while not mentioned in the above articles, tends to dictate the quality of education, job opportunities, and many other cultural and economic factors. This calls into question the ‘diploma divide’ being the most useful framework through which to understand the division of the electorate.
If not education, then what?
A look at the Gallup U.S. Daily Poll, which randomly polls 1000 Americans citizens daily on pressing issues, can shed light on the matter. The type of city one lives in or one’s education might be what influences one’s probability of voting for Trump; these might also just be correlated with whatever the actual cause is. It is important that citizens and policymakers entertain all reasonable possibilities
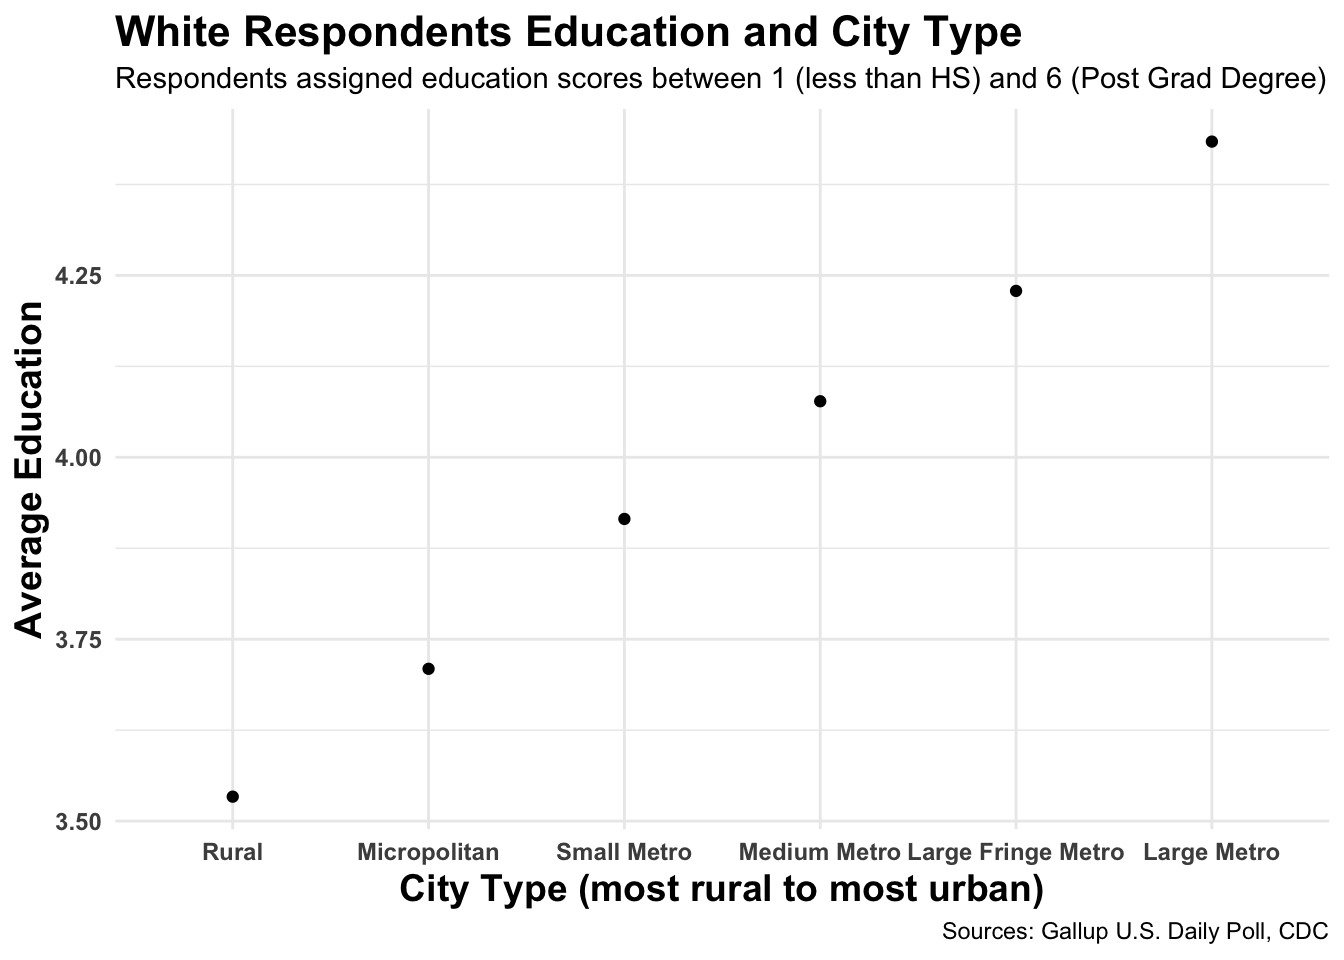
The plot below shows a clear linear correlation between the average education of white respondents and city type. This is the relationship which is described in the articles above.
In the next dot plot I show the relationship between city type and the percentage of voters who voted for Trump. Both of these graphs show similar trends. This supports the hypothesis that levels of education among whites might just be associated with city type which could be the real cause of the political division.
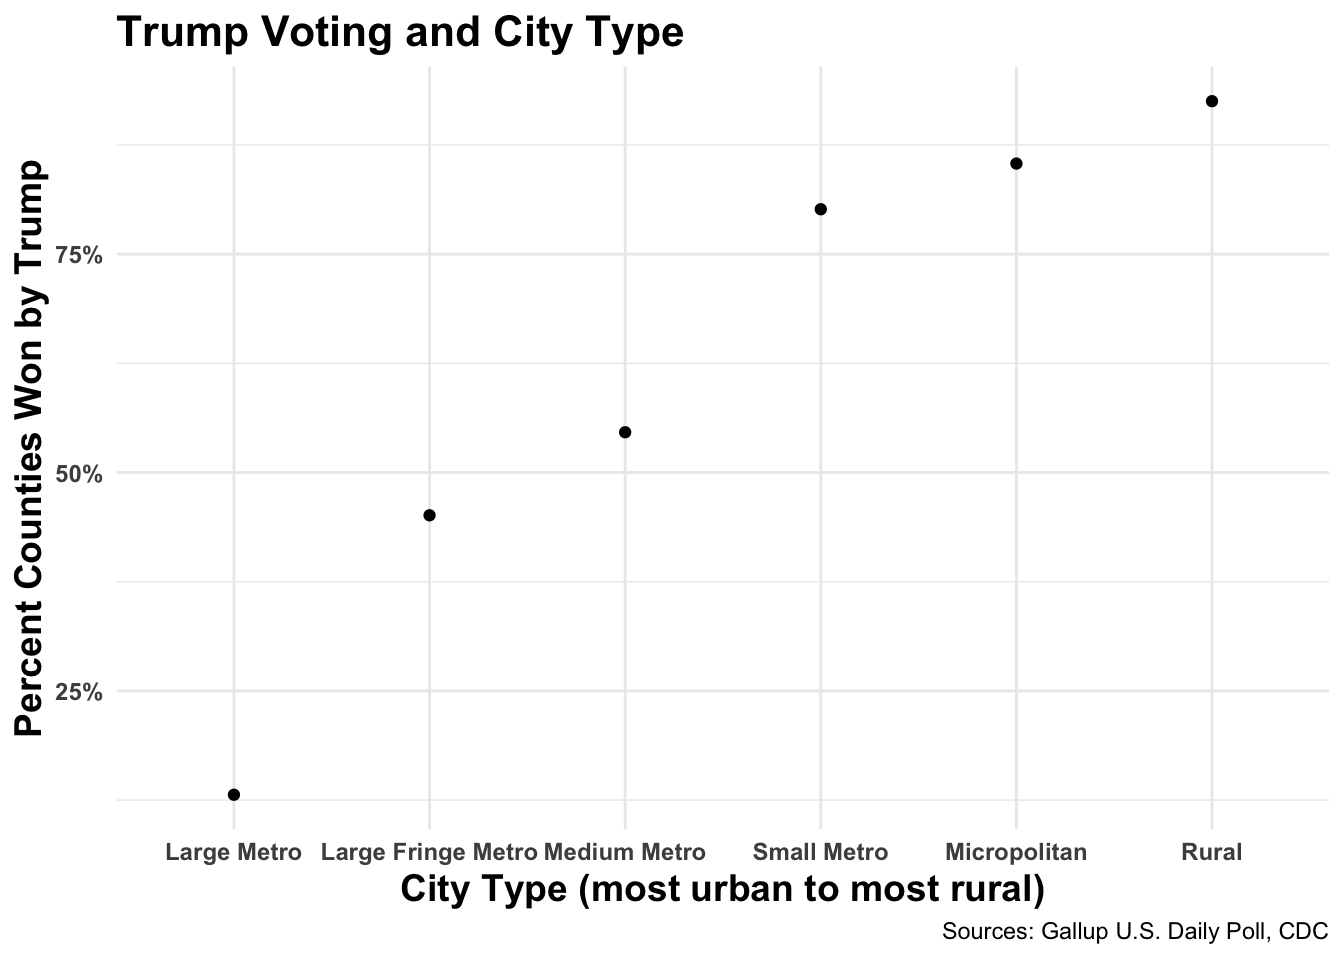
The correlation between education and city type makes it difficult to determine which, if either, is the primary cause of Trump voting.
Dangers of Correlation
Exit polls indicated that Hillary Clinton won college graduates by a margin of 10% and Trump won non-college graduates by a margin of 7%. Since this was not shocking to many people, education was taken not as just correlated with Trump voting, but causing it.
We will look at the responses of four different groups of counties in the Gallup US Daily poll to explore what else is correlated with Trump voting. The four groups are made up of counties that:
Democrat: voted Democratic in the presidential race in 2012 and 2016
Republican: voted Democratic in the presidential race in 2012 and 2016
Flipped Democrat: voted Republican in 2012 and Democratic in 2016
Flipped Republican: voted Democratic in 2012 and Republican in 2016
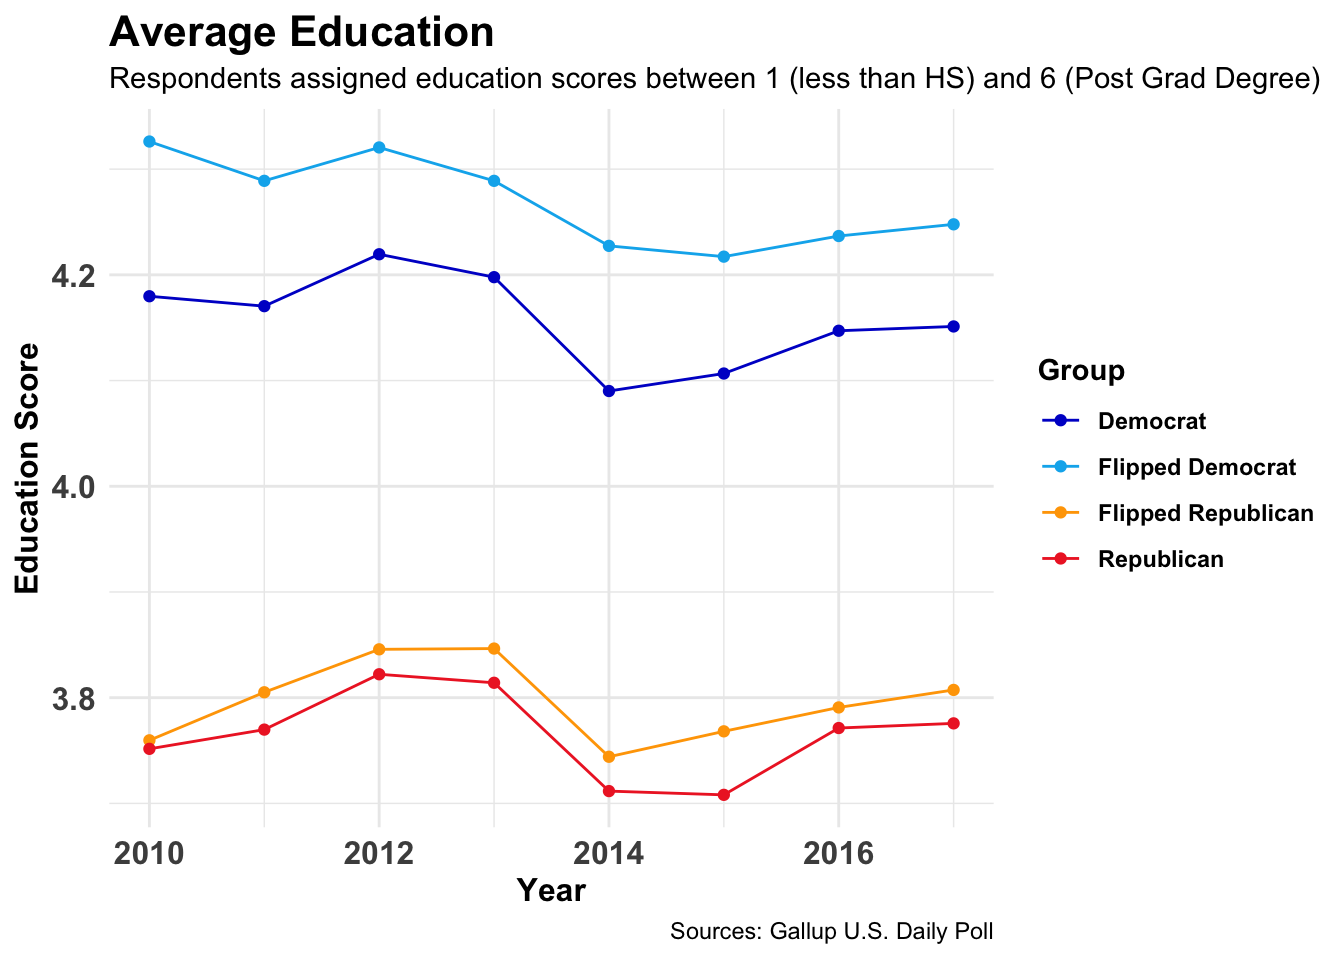
Aside from education, there are countless variables which help predict which counties were likely to vote for Trump. For example, the percent of survey respondents who reported that they had health problems turned out to be quite effective. High incidences of health problems indicated that a county was likely to vote for Trump.
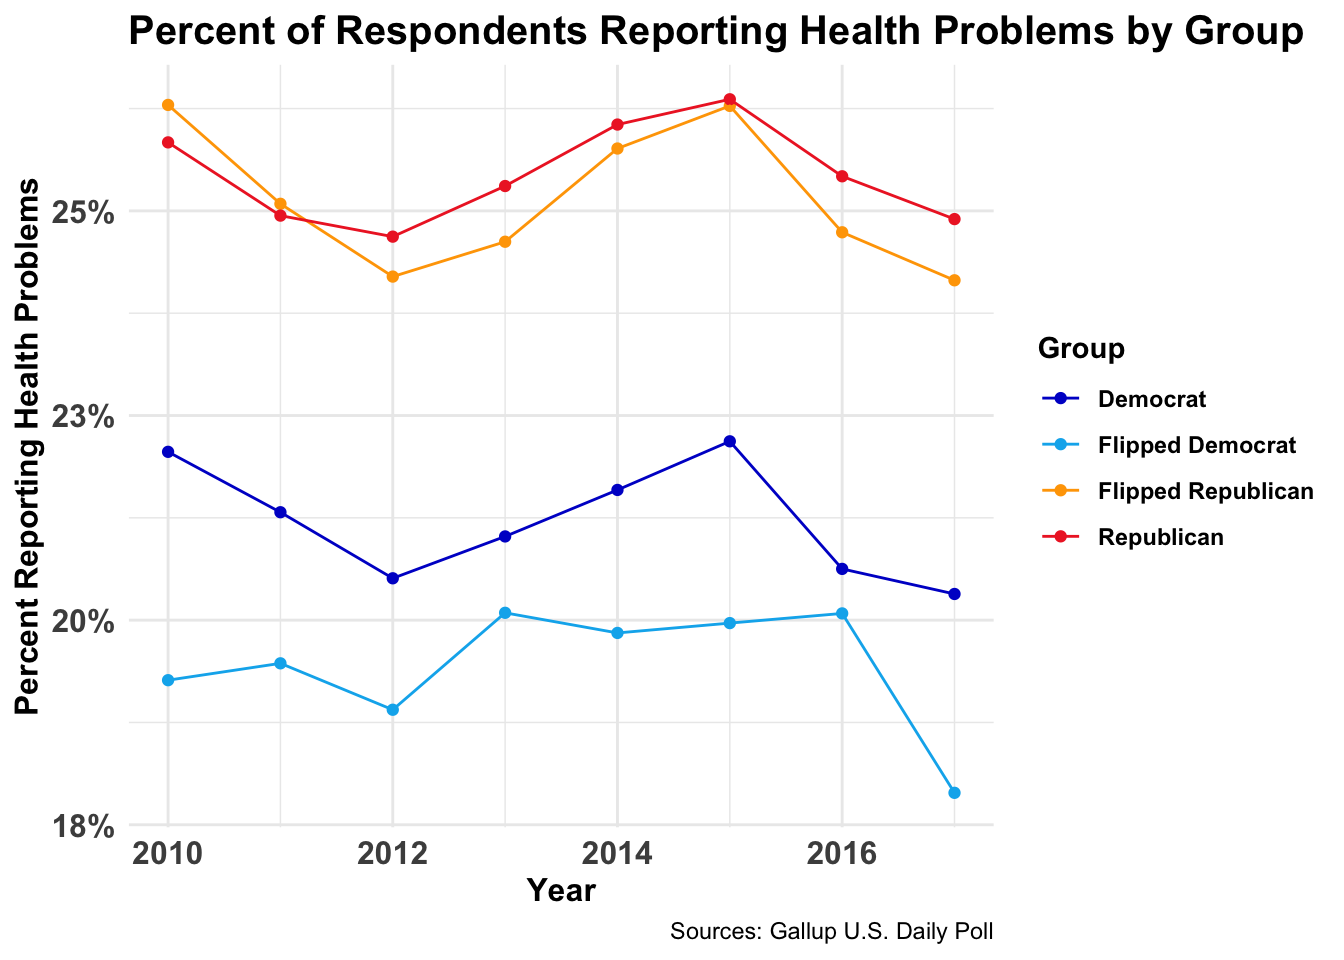
Average body mass index proved to be even more predictive than health problems. In fact, it performed comparably to average education level at predicting how a county would vote.
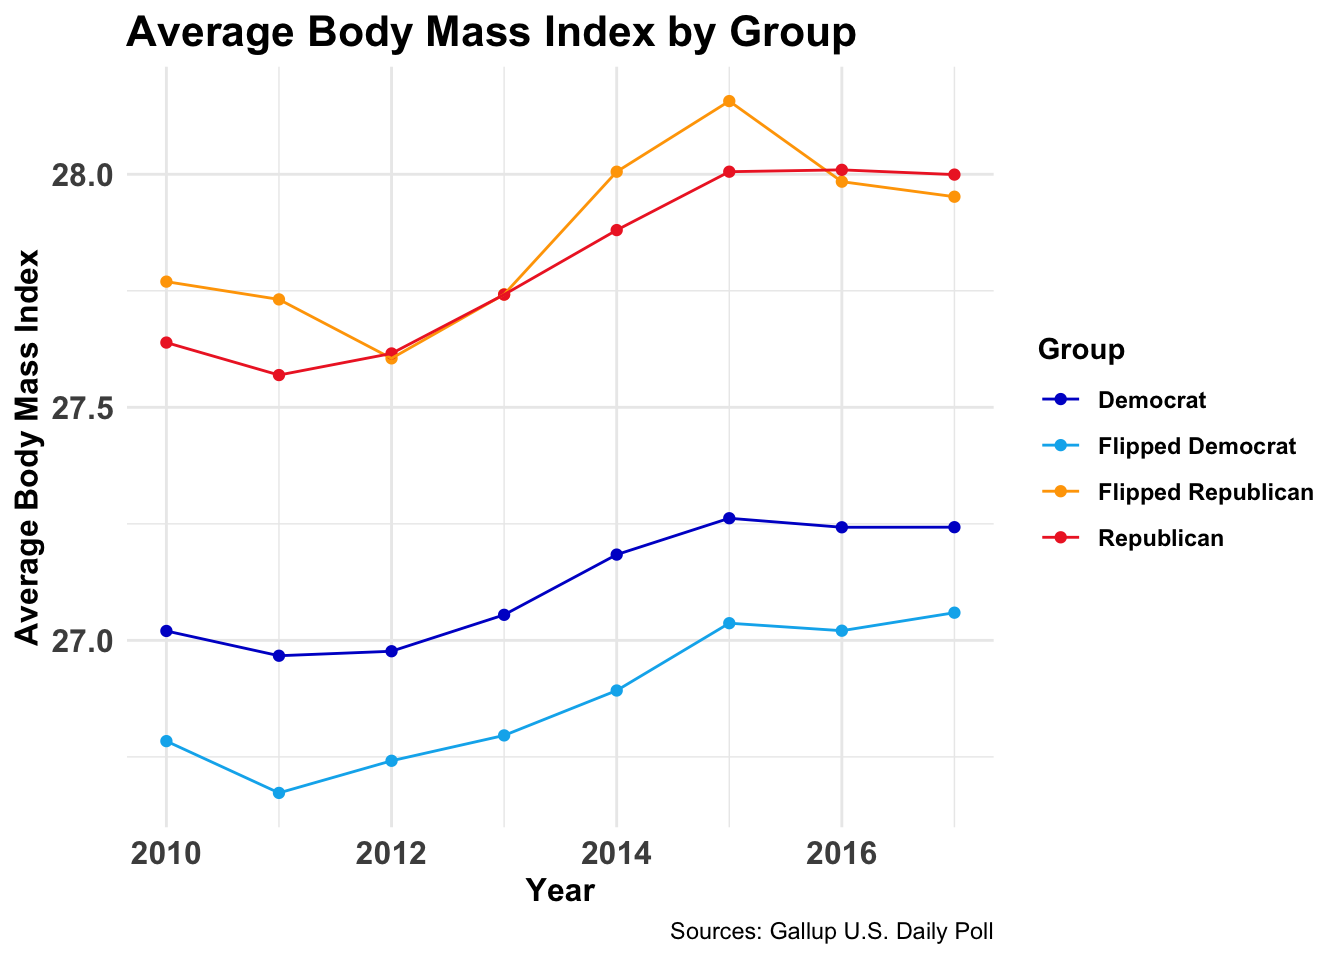
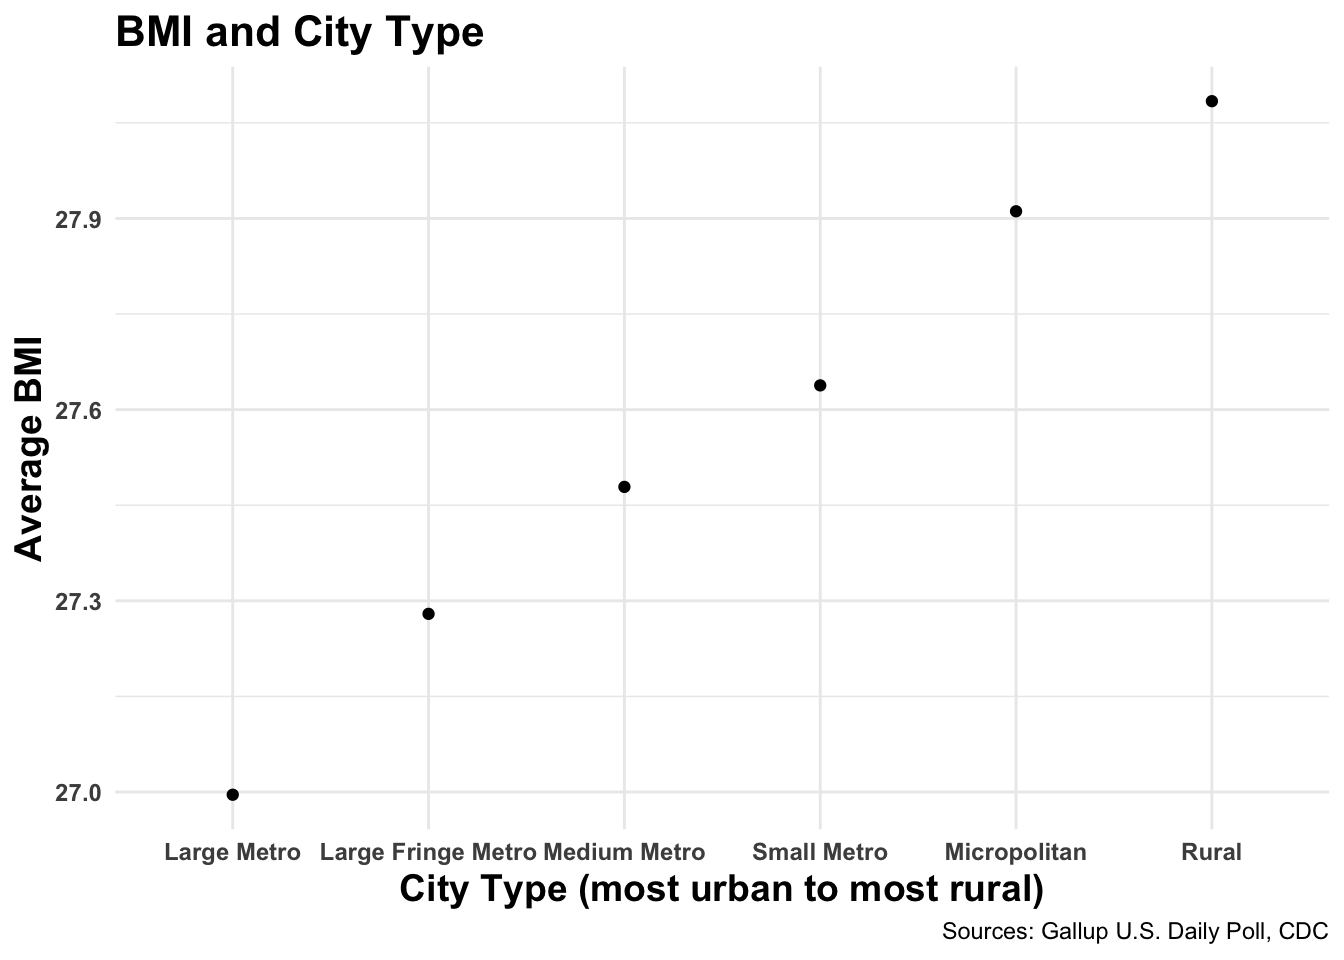
BMI, also, seems to be extremely highly correlated with city type and education. This dot plot has the same linear shape as the previous dot plots. Therefore, it is clearly correlated with the average education and city type.
The reason one is less likely to assume BMI is what is causing these voting patterns because it strikes them as strange. However, there is no more evidence supporting BMI being the cause of Trump voting than education levels. It’s all correlation.
These graphs demonstrate that a variety of socioeconomic phenomena are effective predictors of 2016 voting. There are a wealth of possible theories which are reasonable and can be tested. It is prudent to avoid assigning one to be the true framework to understand our political division just yet.
Entertaining All Options
When drawing conclusions on important matters of policy, we should all heed the advice of my old defensive coordinator, “Don’t be fast to go nowhere!” More in-depth work is required to determine how each of these factors affects Trump voting.
Knowing the answer will not solve our political divide. However, it is imperative that candidates and voters do not allow the narrative of the ‘diploma divide’ being responsible for new voting patterns to dictate policy.
A geographic divide, an educational divide, and other reasonable hypotheses should all be entertained as possible causes of recent voting trends. It is vital that we do not make policy for over 325 million Americans based on incomplete information.
.
.
References:
Gallup US Daily Tracking Poll https://www.gallup.com/home.aspx
“NCHS Urban-Rural Classification Scheme for Counties”, Center for Disease Control, 2017 https://www.cdc.gov/nchs/data_access/urban_rural.htm
Harris, Adam. “America Is Divided by Education.” The Atlantic, Atlantic Media Company, 7 Nov. 2018, www.theatlantic.com/education/archive/2018/11/education-gap-explains-american-politics/575113/.
Zitner, Aaron, et al. “The New Divide in Politics: Education.” The Wall Street Journal, Dow Jones & Company, 10 Nov. 2018, www.wsj.com/articles/midterm-results-point-to-a-new-divide-in-politics-education-1541865601.