Authors: Toren Fronsdal and Eric Gilliam
“Whoever would overthrow the liberty of a nation must begin by subduing the freeness of speech.”
- Benjamin Franklin
In April 2017, Ann Coulter, a far-right political commentator, had to cancel an appearance to speak at the University of California Berkeley. The university said it could no longer accommodate her on the scheduled date because of threats of violence. Just months earlier, Milo Yiannopoulos, former Breitbart News columnist, was due to visit the same campus. Riots erupted in response to his potential visit, with protestors setting fires and vandalizing buildings. The damage totaled was $800,000.
Last winter at Stanford a group of students delivered a letter to Stanford President Marc Tessier-Lavigne expressing their disapproval of the university hosting Charles Murray. In his book, The Bell Curve, Murray argues that racial differences impact human intelligence and that intelligence is affected by a mix of inherited and environmental influences. One of the leaders of the club responsible for the letter of dissent noted, “As an educational institution, I feel like Stanford has the responsibility to only legitimize certain types of viewpoints.”
In light of recent high-profile protests, some say free speech is under attack. “Anyone who dissents must be thrown off [campus],” said Ben Shapiro, a conservative political commentator who believes the left is carrying out a war on free speech.
A look at data from the General Social Survey tells a different story. This survey is run by the National Data Program for the Social Sciences at the University of Chicago. The survey aims to monitor the opinions of US citizens on topics such as civil liberties, crime and violence, and social mobility. The survey which has monitored societal change since 1972, indicates that support for free speech is as strong as ever.
The survey – conducted once every two years – is most useful as a way to understand general trends, not look at year-to-year comparisons. But those broader trends show a clear picture contrary to the common narrative surrounding backlash against controversial speakers.
The State of Free Speech
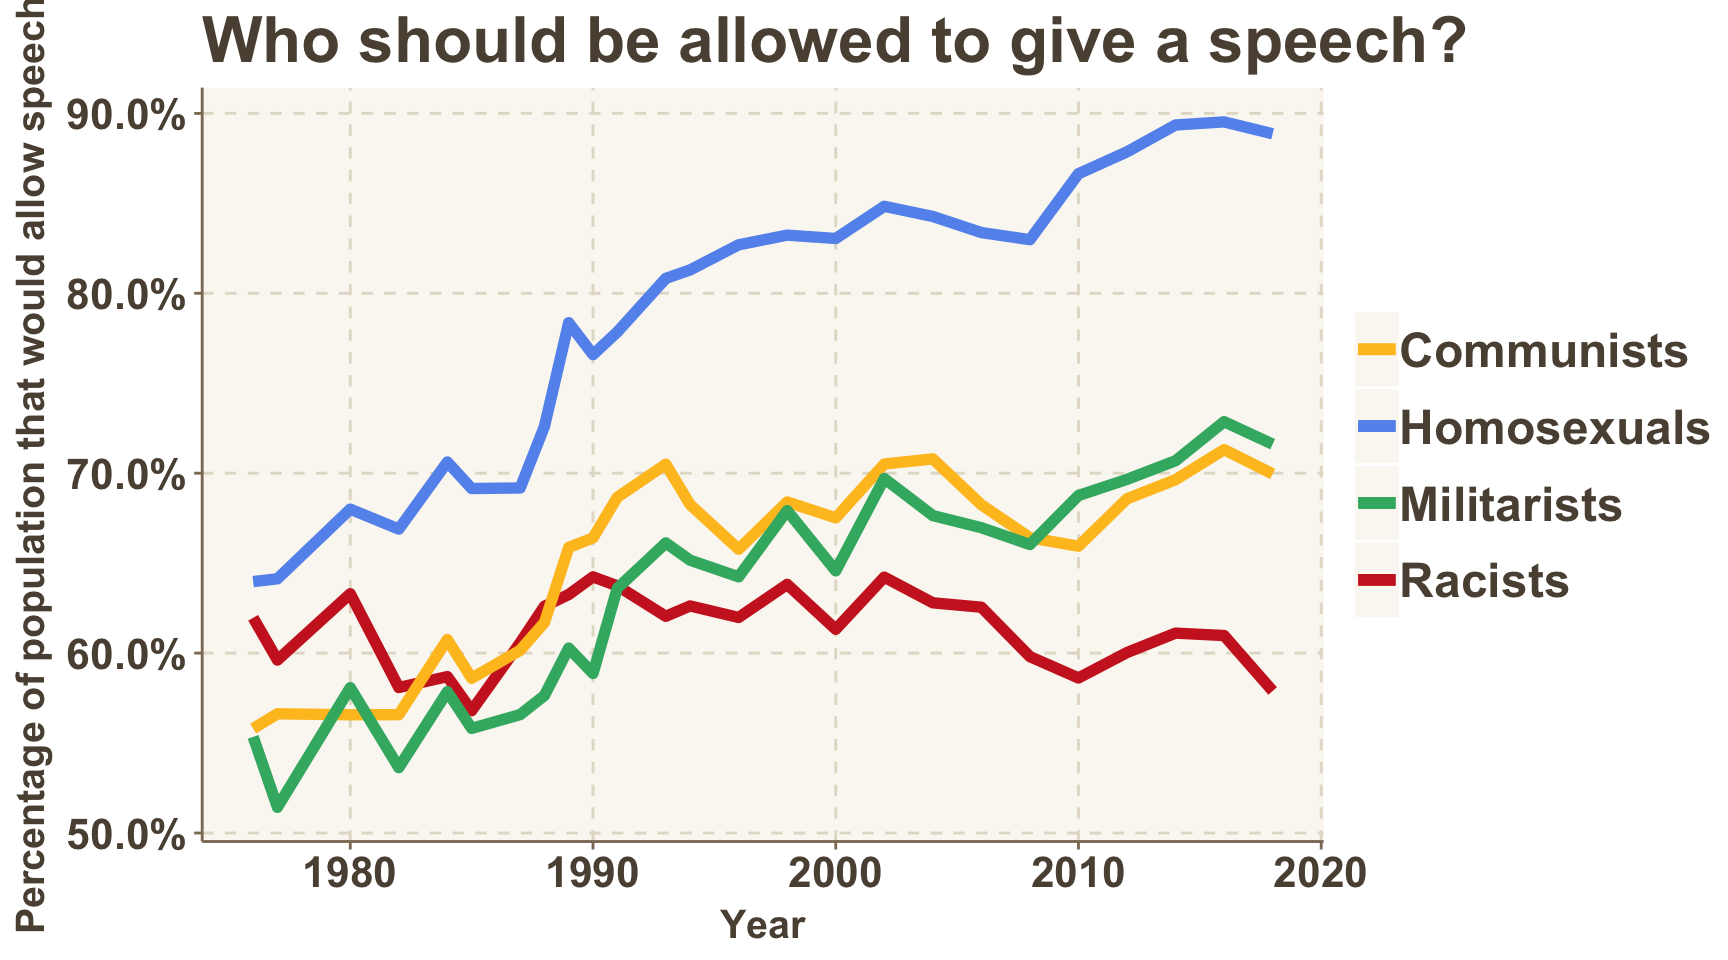
The percentage of survey respondents in favor of allowing different types of speakers appear to be as high as ever. There is a key exception: speakers who are considered racist.
We see this same trend with the types of books respondents believe should be allowed in the library.
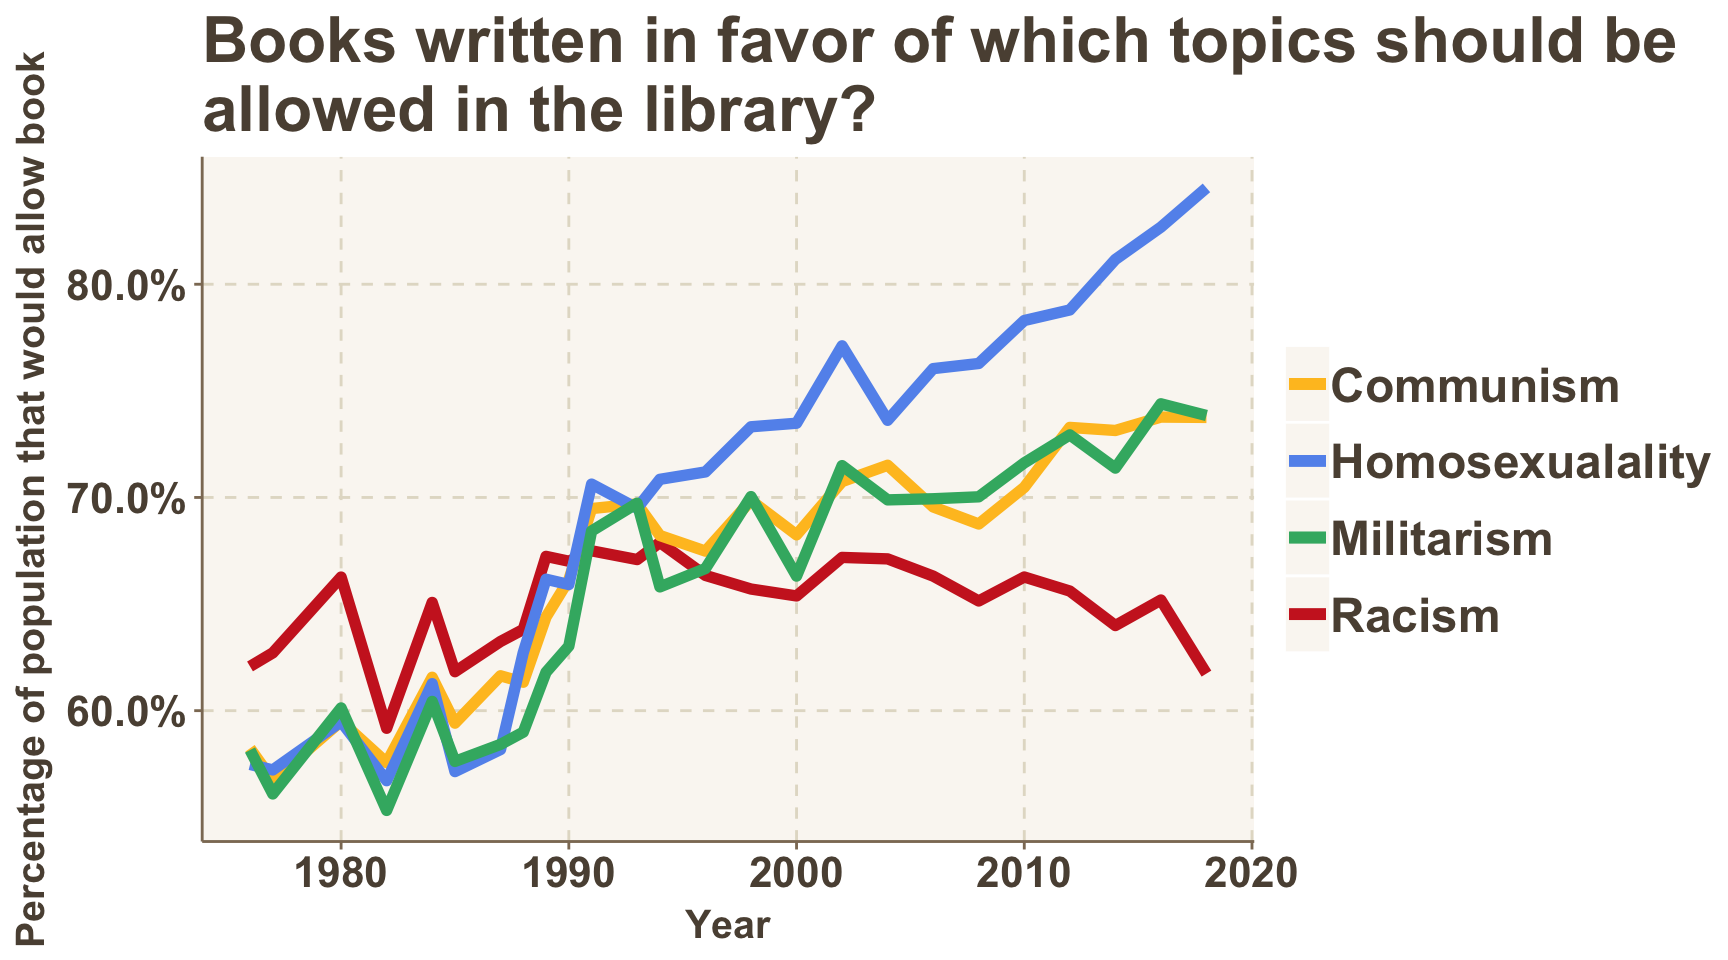
The dip in support for some types of books being allowed in the library is an interesting trend, but is only one data point. More future surveys will be required to see if this trend is significant.
Broken Down By Age
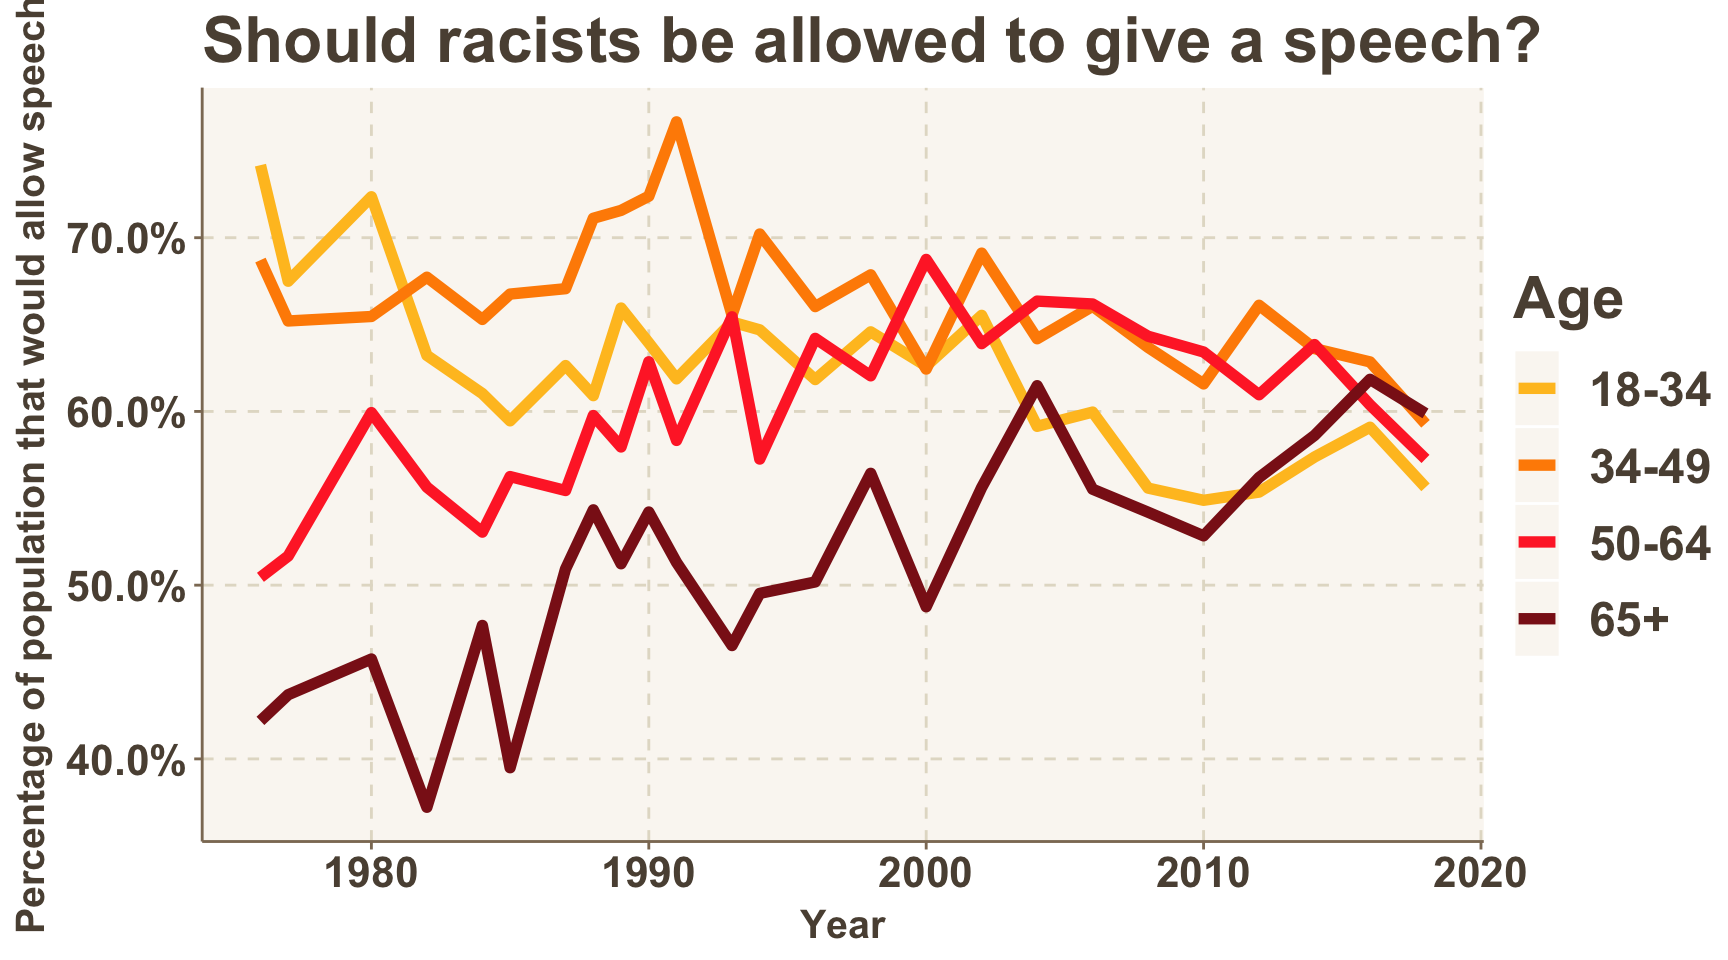
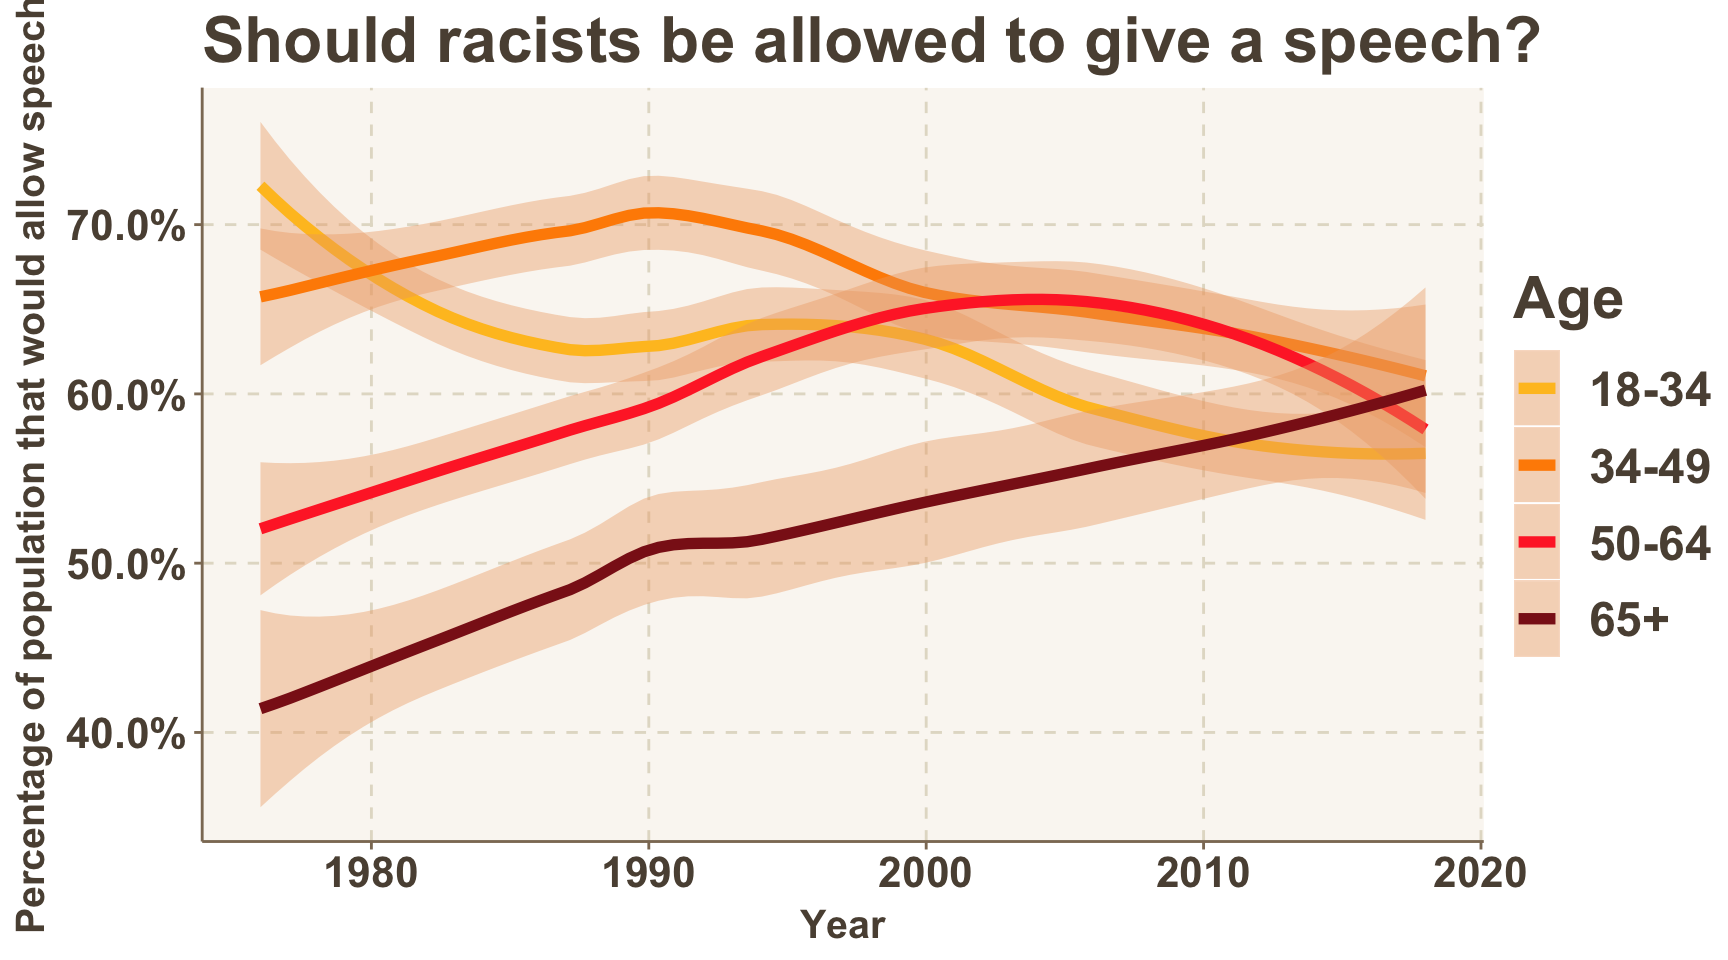
There are some differences among age groups. Below, we see that while the 50-64 and 65+ age groups have both grown more open to allowing people with racist views to speak over time, the opposite is true for the 18-34 and 34-49 age groups. To many this will be unsurprising. Newspapers are filled with stories of intolerant, young protesters on college campuses who are not open to hearing certain views.
Below, we smooth out the trends in the graph above to make the trends more clear.
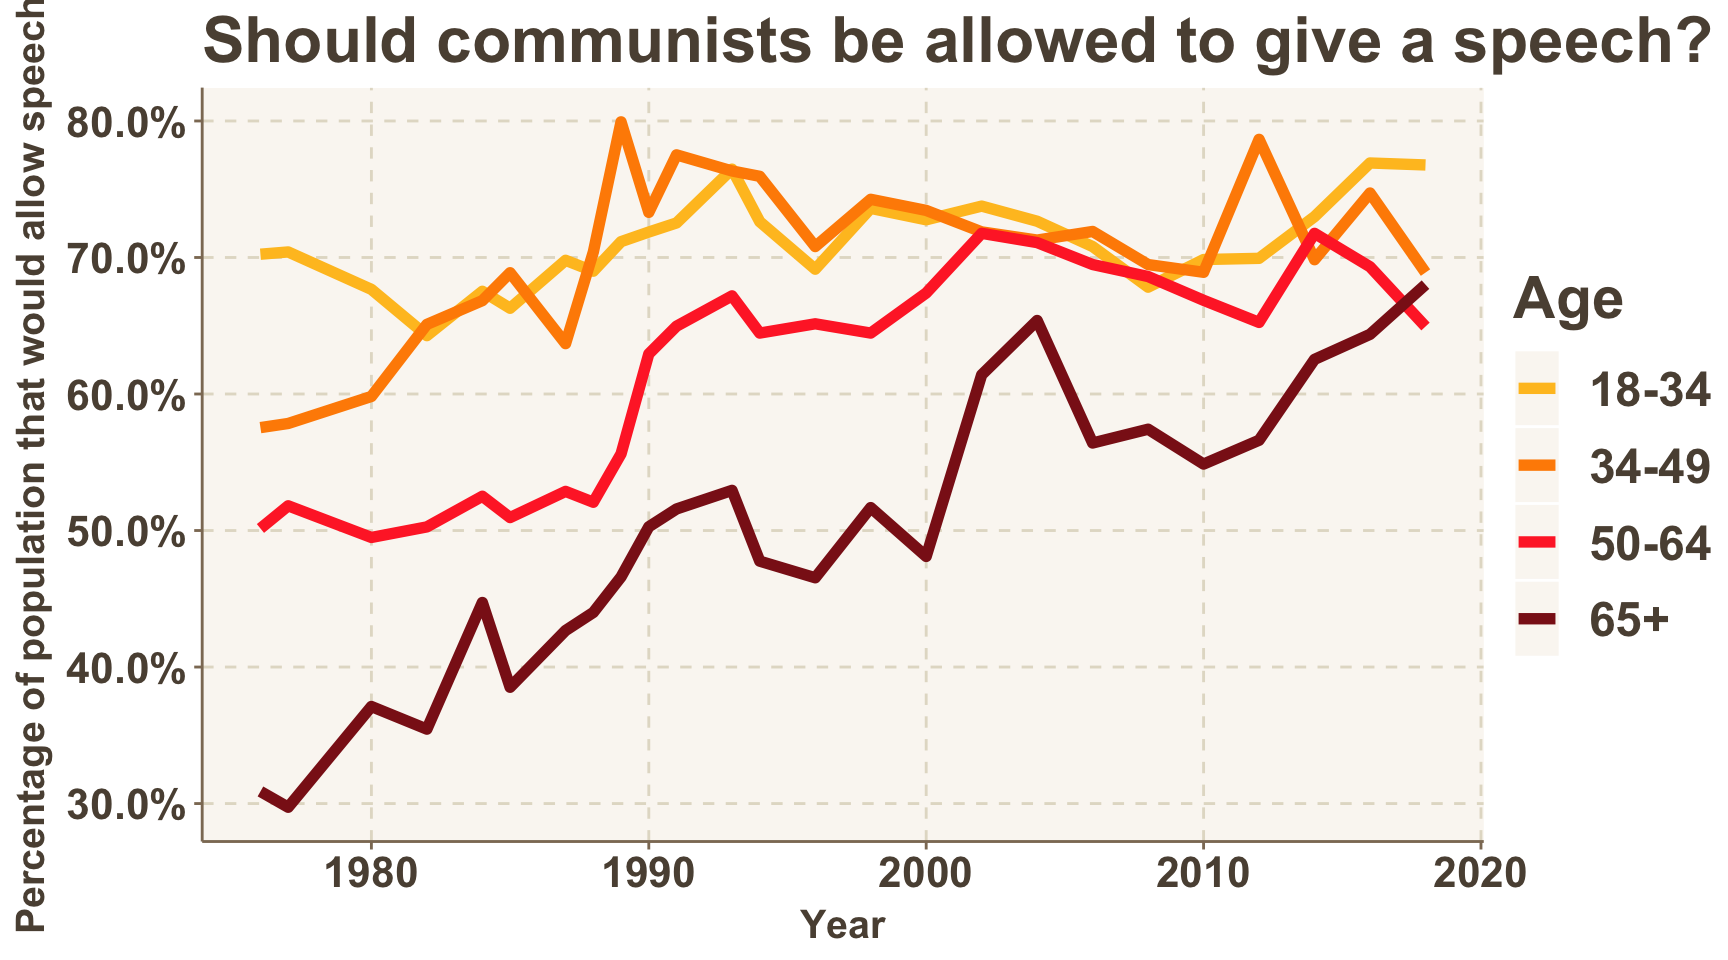
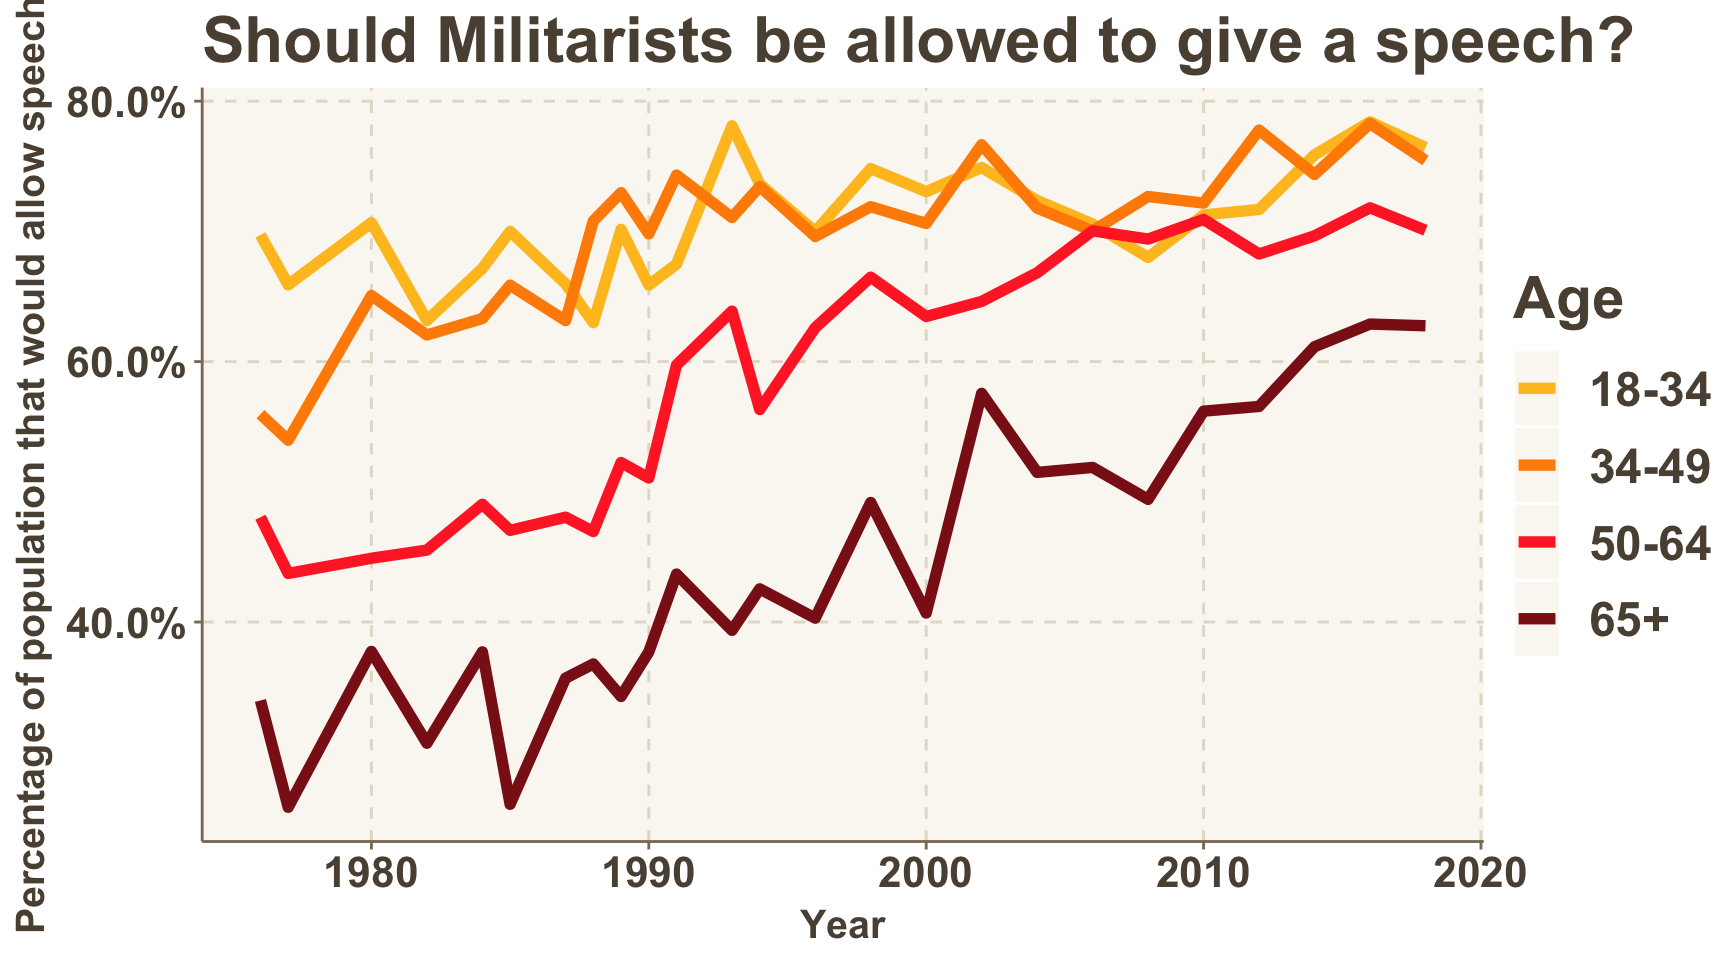
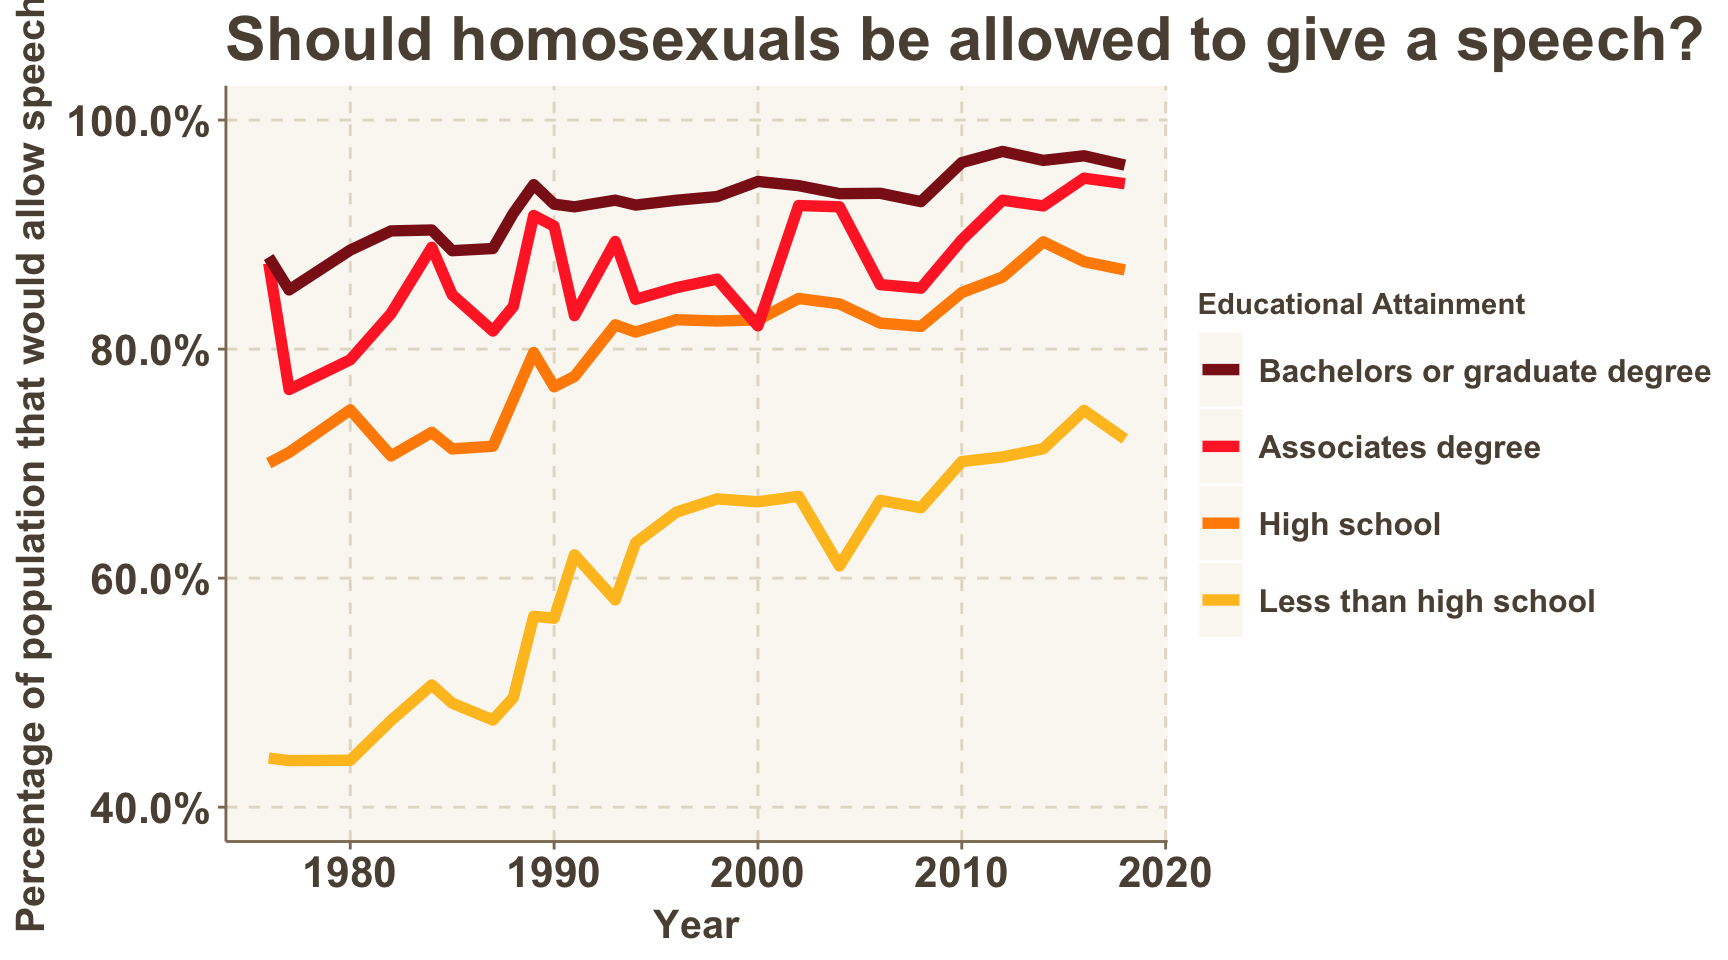
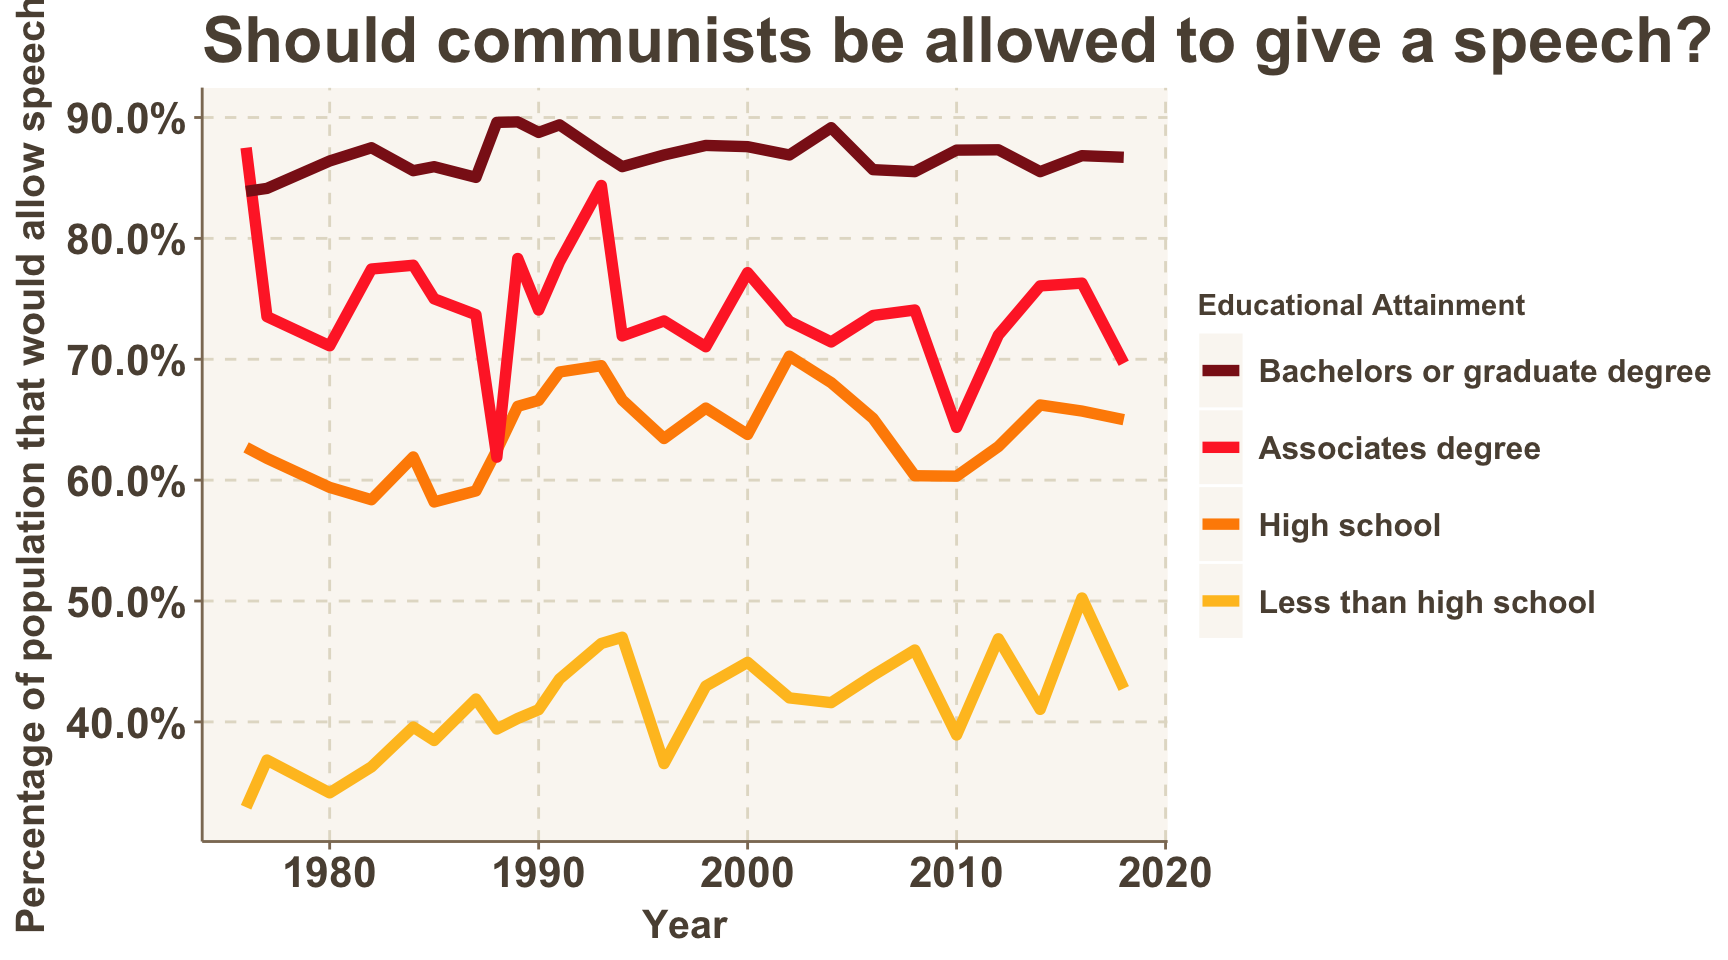
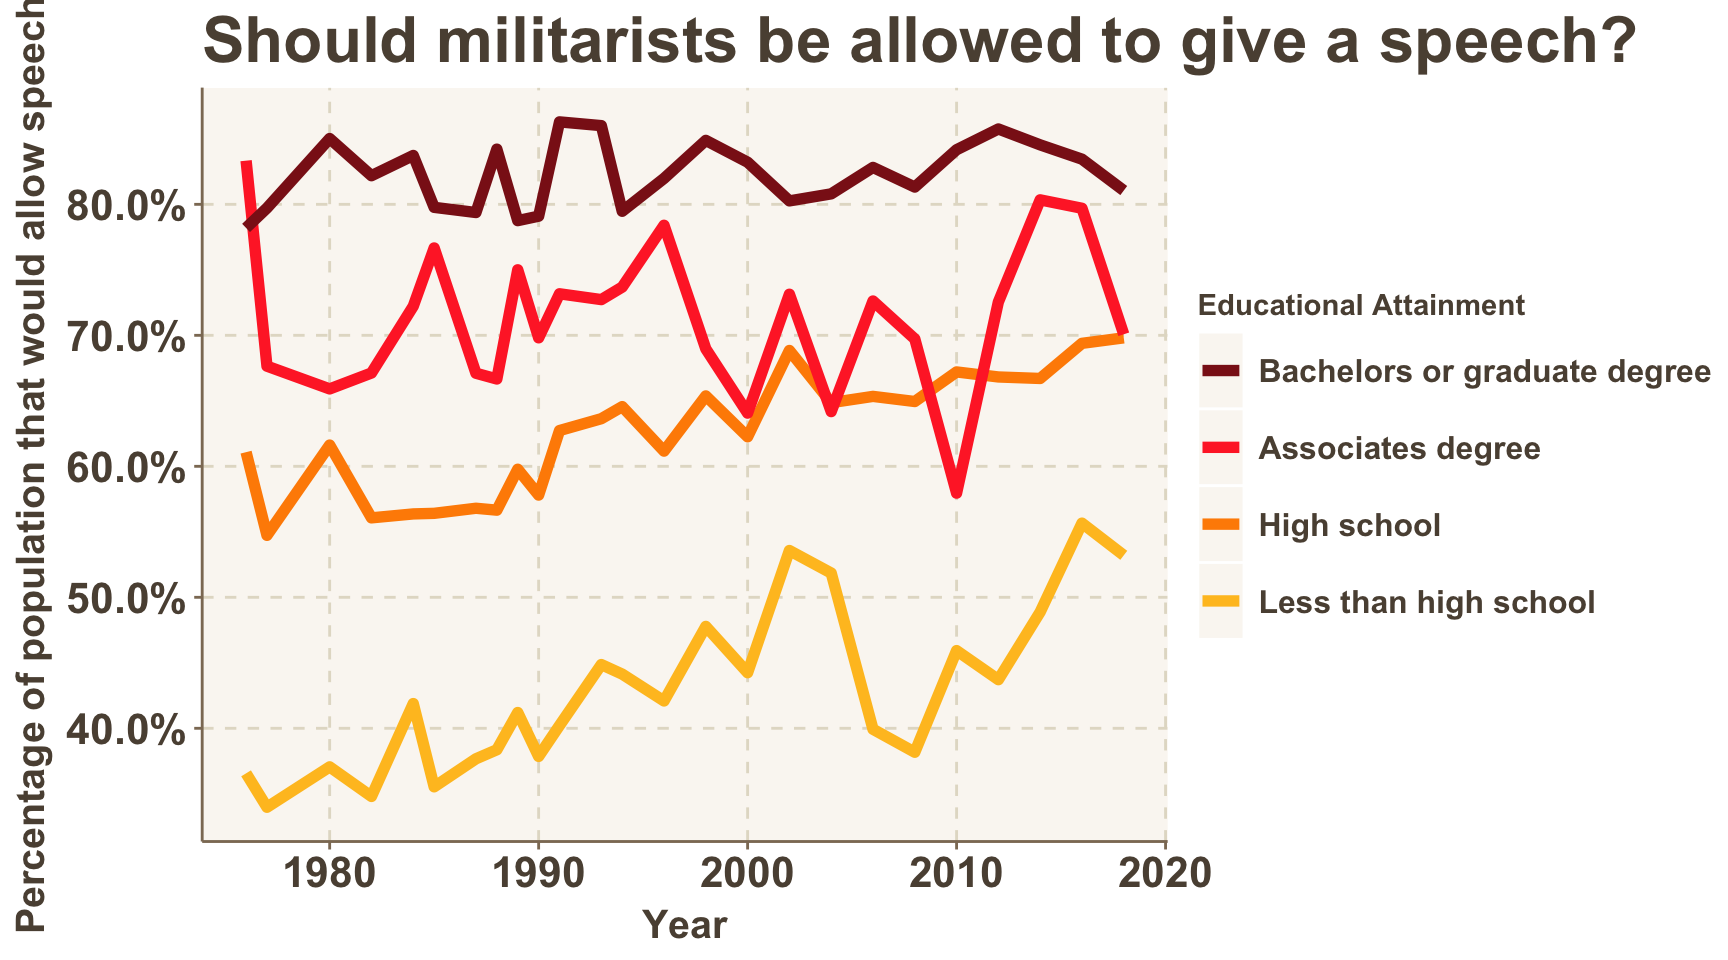
The graphs below, however, begin to tell a very different story. The percentage of people in each age group willing to allow homosexuals, communists, and militarists to speak has been steadily increasing over time. The only exception to this pattern of increasing levels of tolerance for speakers is for the category of racist speakers. In this category, the two older age brackets still abide by the trend of increasing allowance of speakers, but, the two younger age brackets have begun to deviate from the normal trend.
With the recent spotlight on speakers being kicked off college campuses, it would be easy to believe that the gap between the younger generation’s tolerance of speakers and the older generation’s tolerance of speakers is growing larger.
But for more than four decades, the tolerance levels for certain types of speakers have grown closer, indicating the gap in tolerance levels of all types of speakers is smaller than ever across age groups.
For example, in the following graph we see the large gap in approval rates between the oldest and youngest groups steadily shrink over time.

People are growing more tolerant of speakers’ views, not less, save the exception of those with racist views by younger respondents.
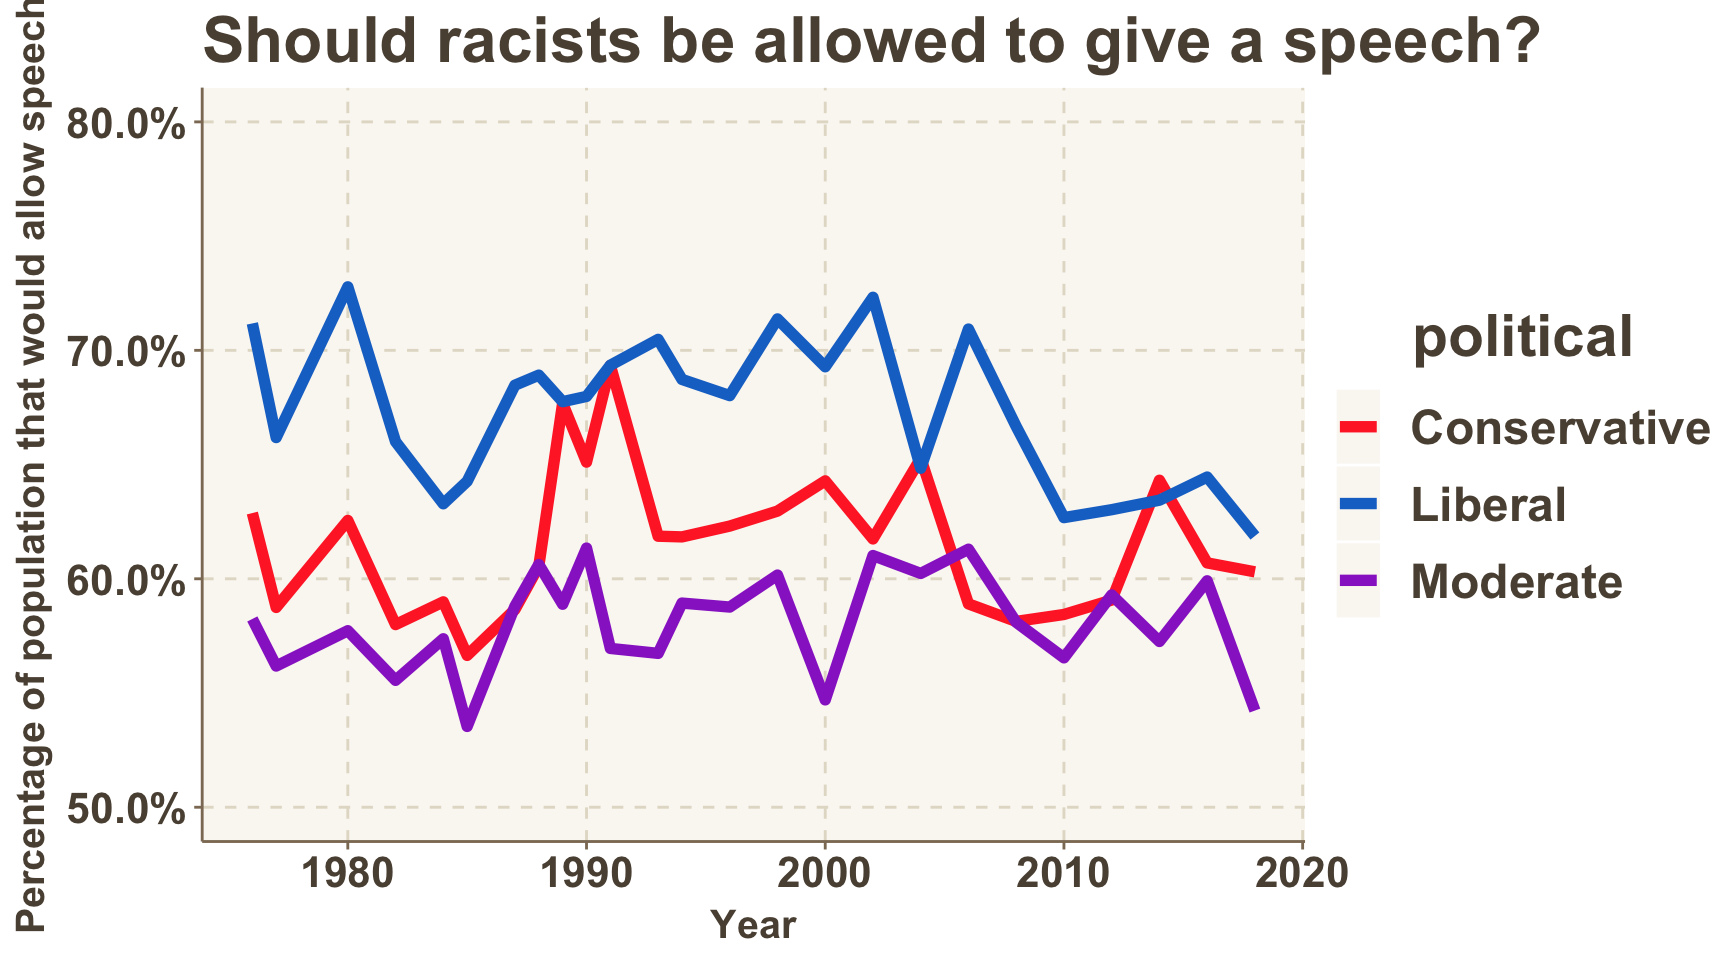
This movement of protesting the right of racist speakers to have a platform for their ideas is considered by many to be a liberal viewpoint.
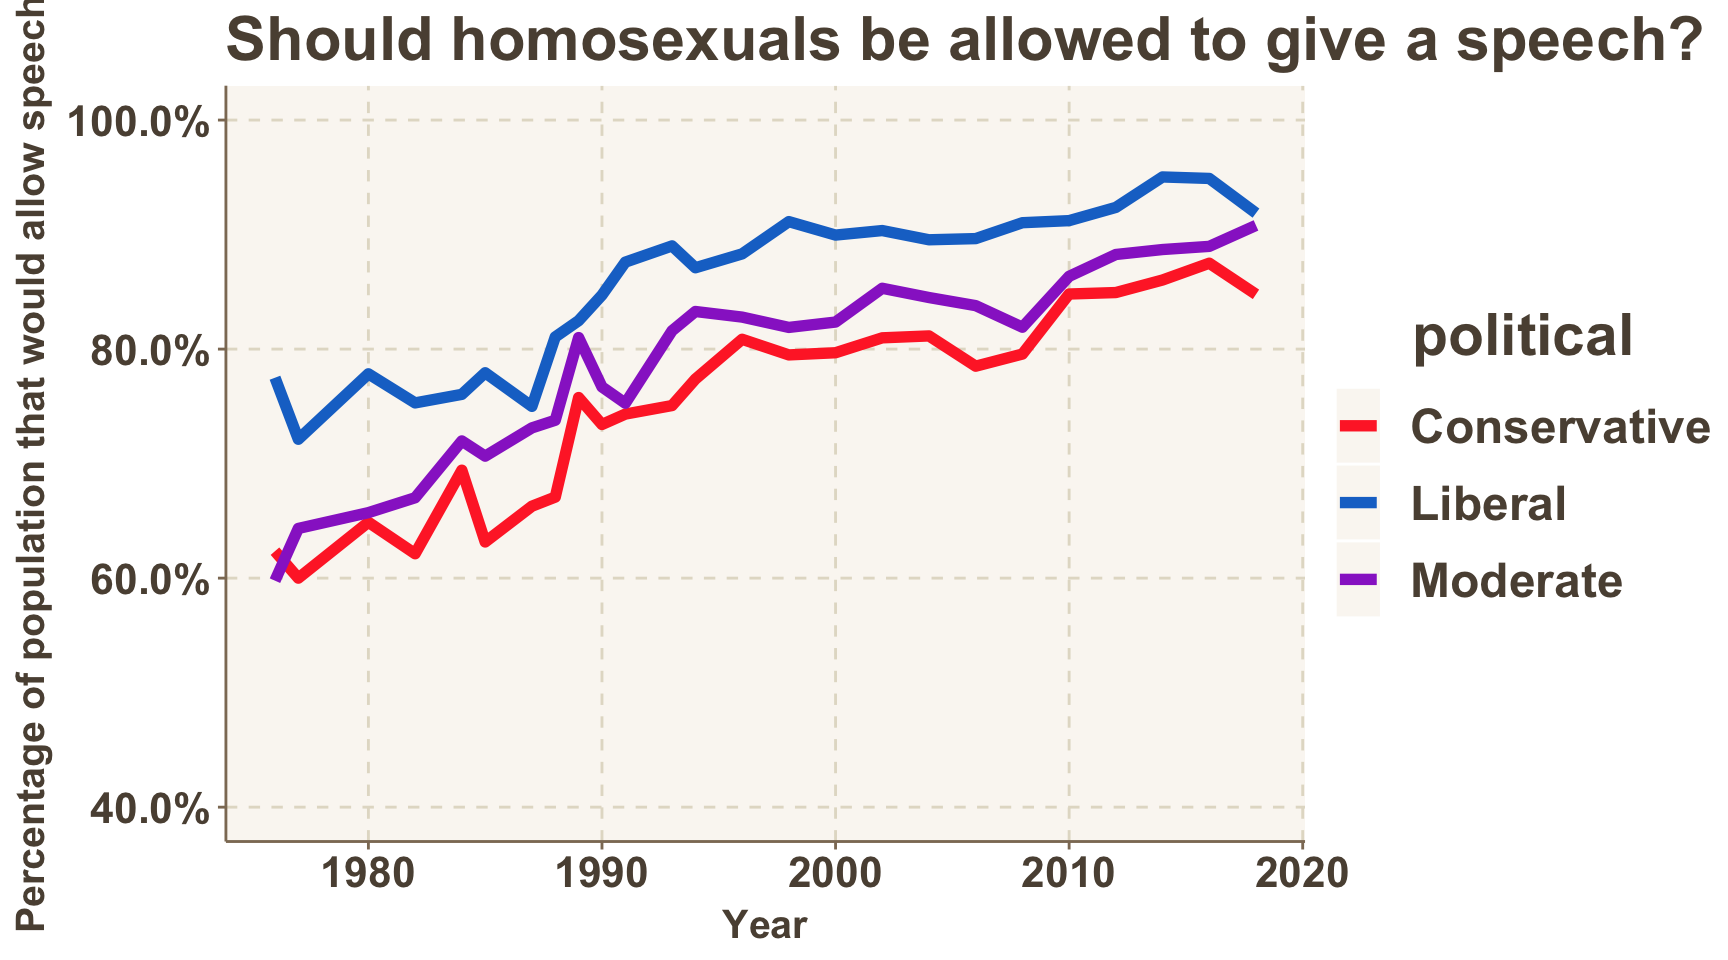
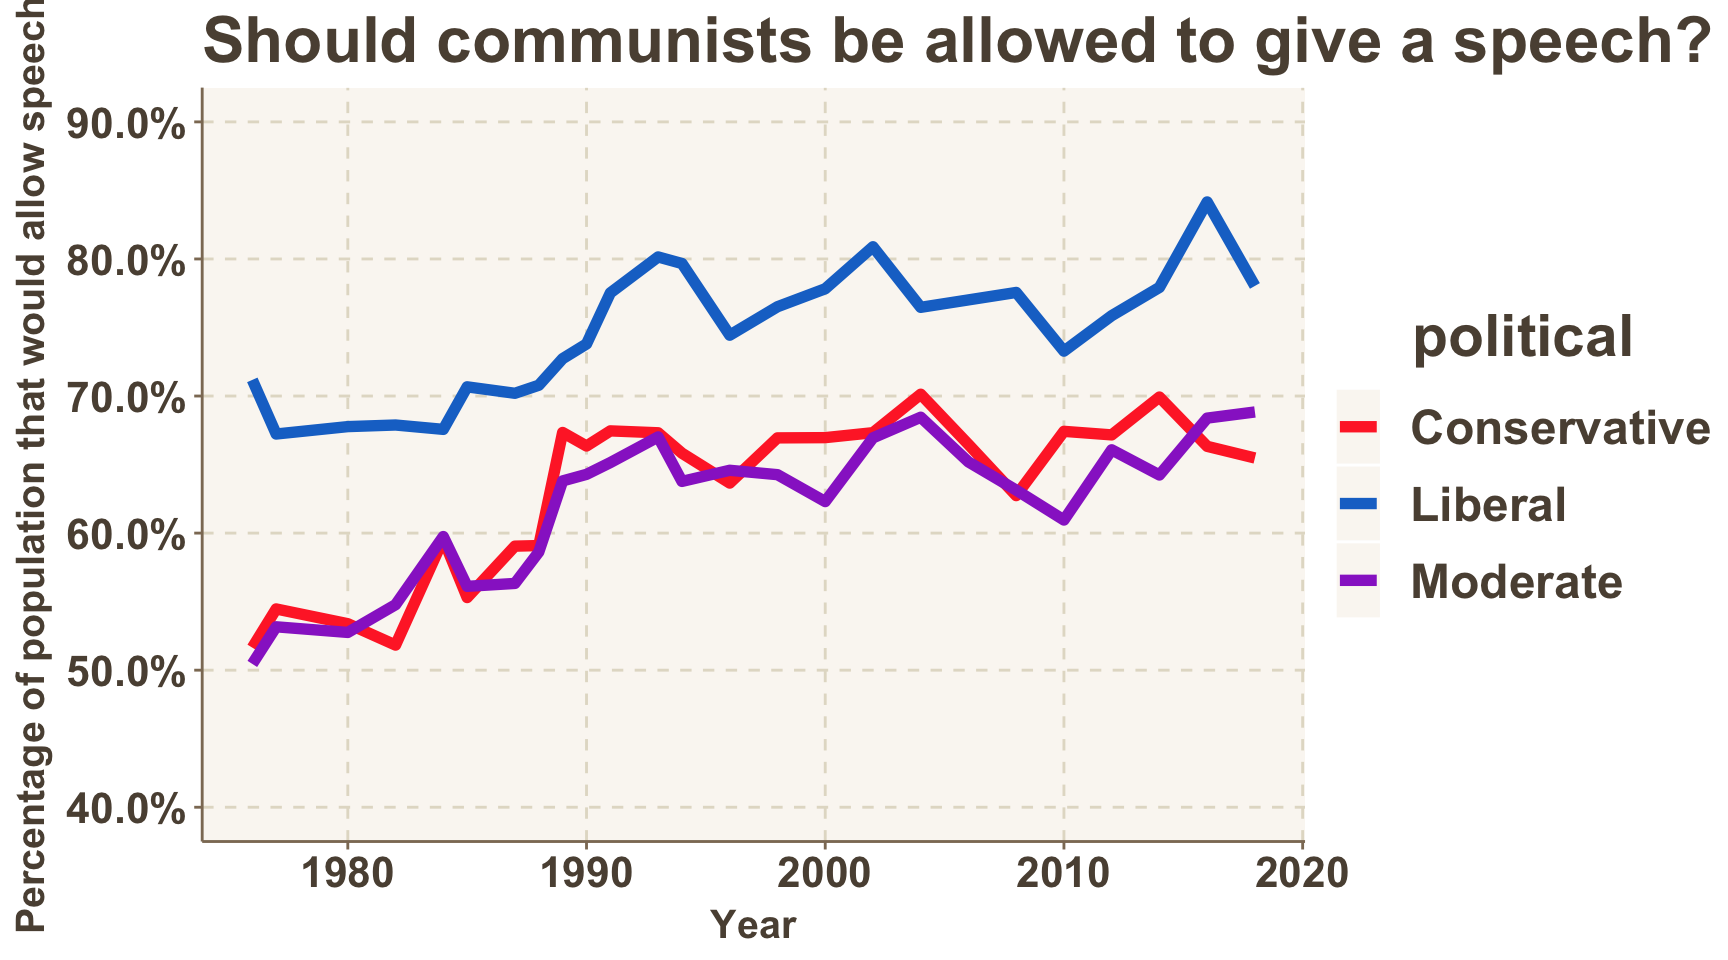
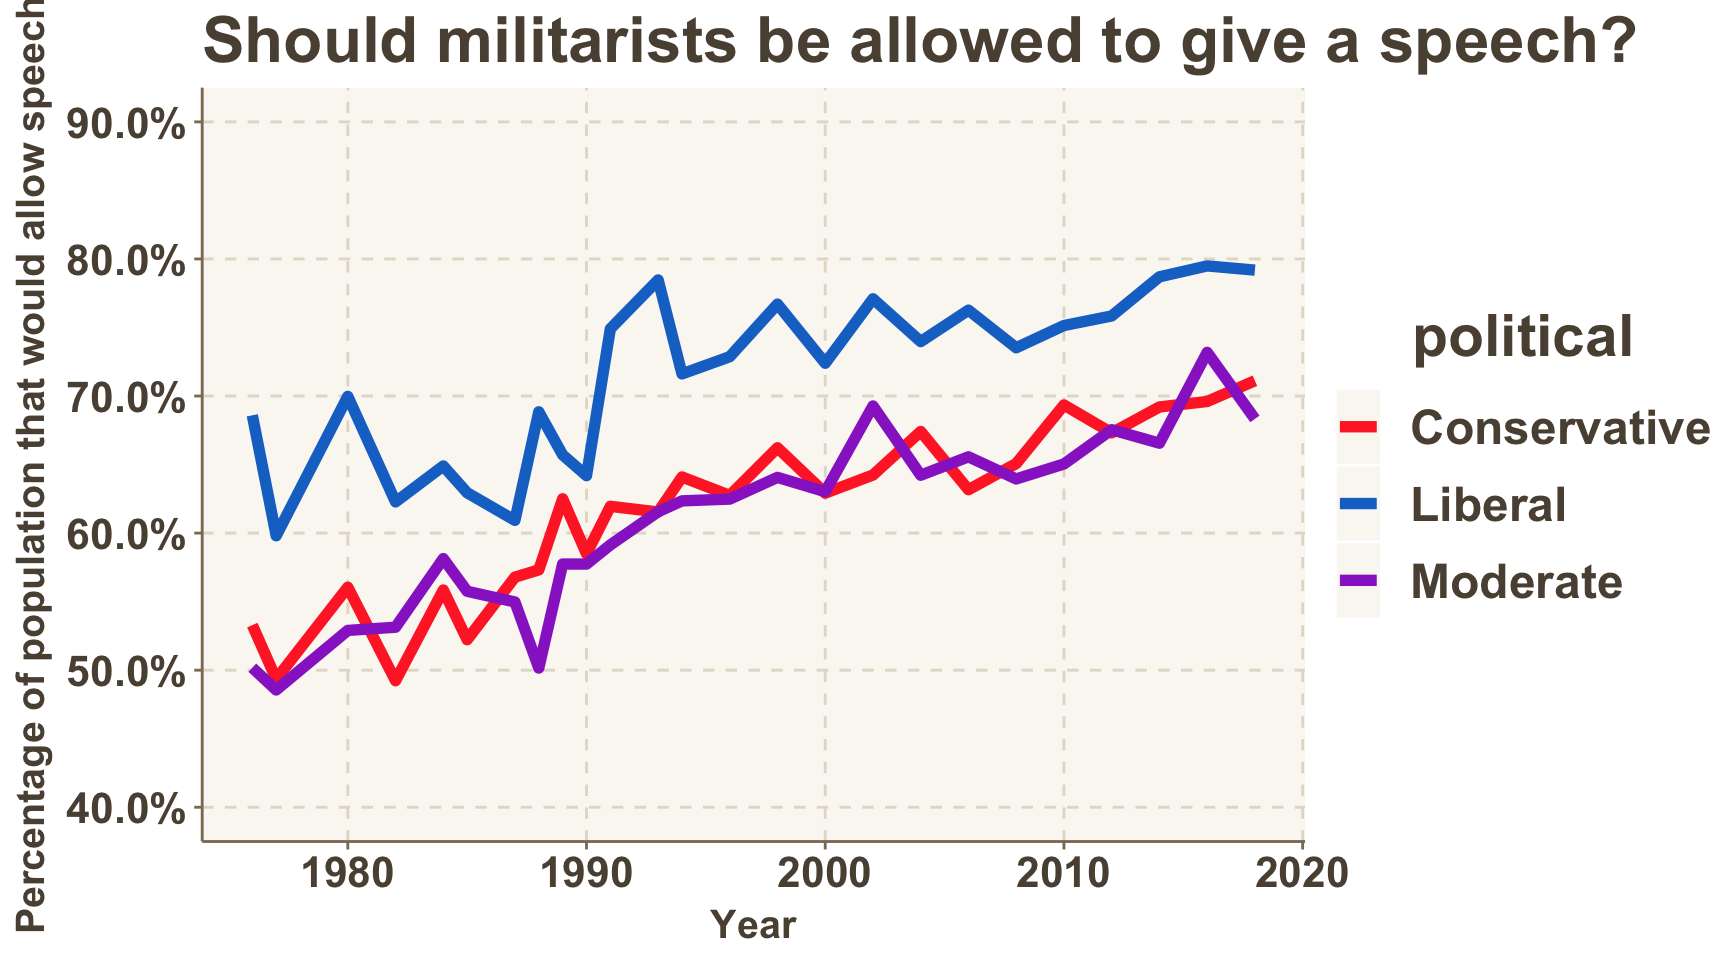
Broken Down By Political Affiliation
The graphs below tell a very different story. Self-identified liberals, in all areas, tended to have the highest rates of support for speakers of any kind.
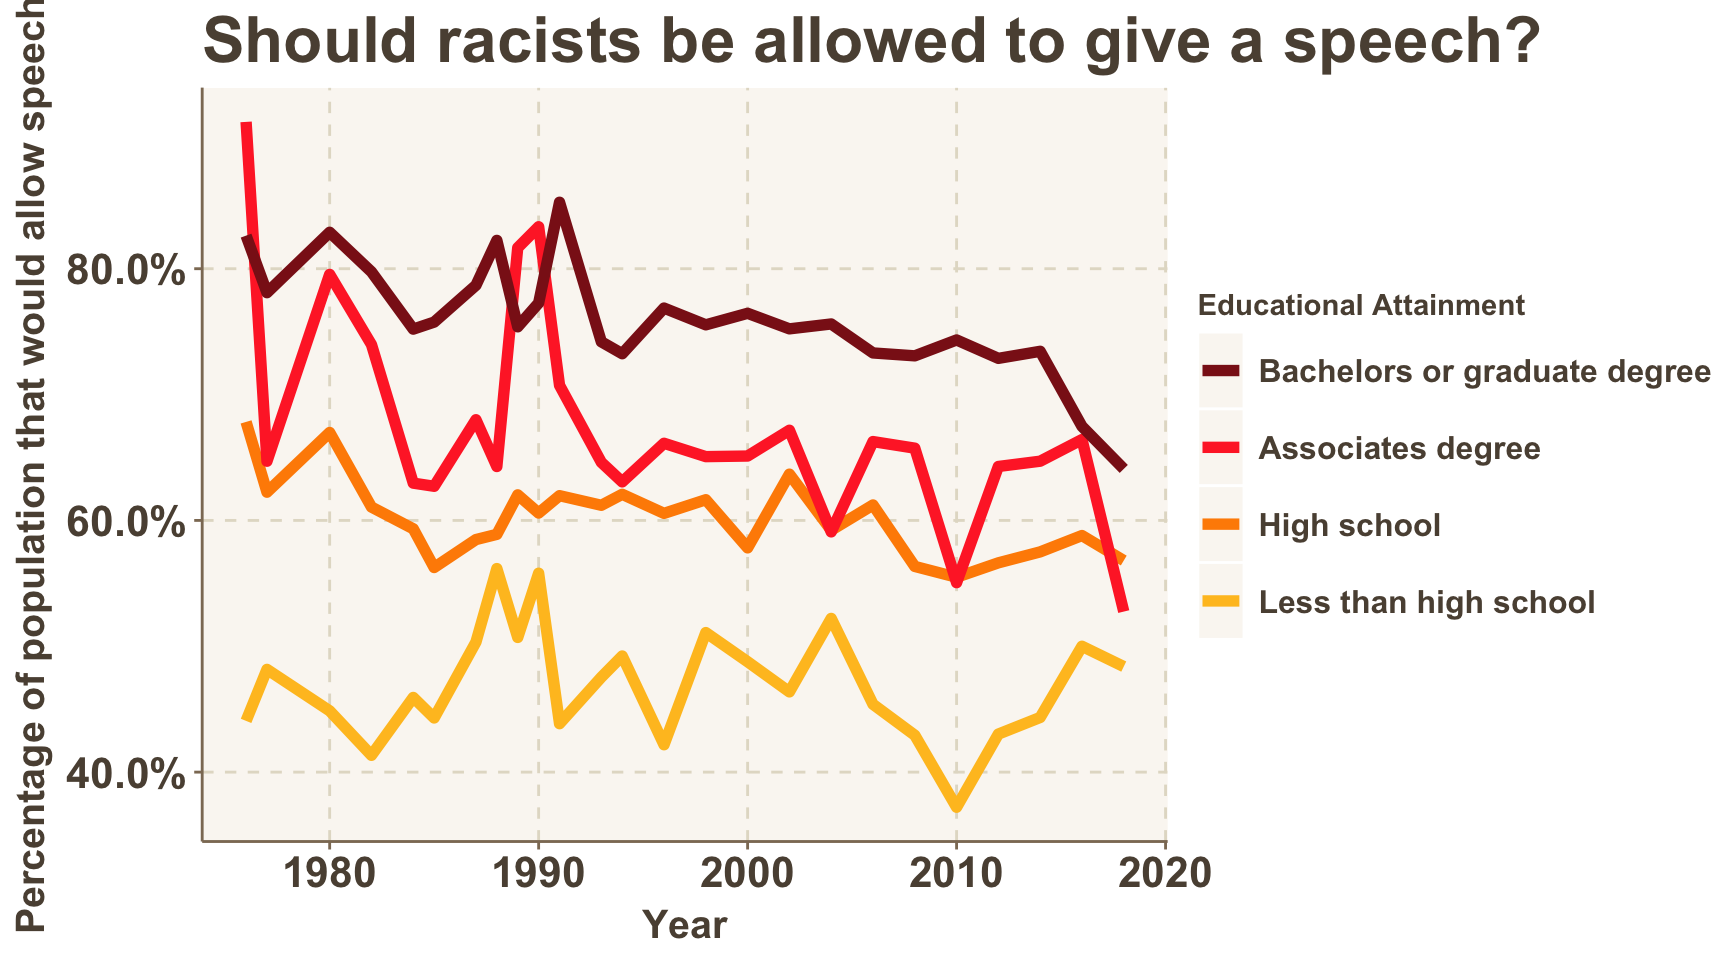
Broken Down By Education Level
This “cancel culture”, characterized by denying those with so-called problematic opinions the right to speak, is also associated with the highly educated and the coastal elite. The graphs below, once again, show that this is the opposite of the truth. Support of free speech for all categories seems to grow with education level, not shrink.
Definitions are fuzzy
It is possible that these student protestors have broader definitions of what is classified as racism or sexism. For example, in 2016, Anita Alvarez, Cook County State’s Attorney, was forced to cut short a talk at the University of Chicago. She was believed to be responsible for “state violence against Black and brown people in the City of Chicago,” by failing to charge a police officer who shot a young black man, the Chicago Maroon reported.
To many, her actions would not constitute racism. Definitions are not always concrete.
Is free speech in trouble?
The popular narrative views the apparent influx in protests against speakers on college campuses as being representative of the views of educated liberals. This might be the wrong framework through which to understand this phenomenon.
The following graphs show the approval rate for racist speakers broken down by age group and political party. We see little discernible difference in approval rates of racist speakers between liberals and conservatives within age groups.
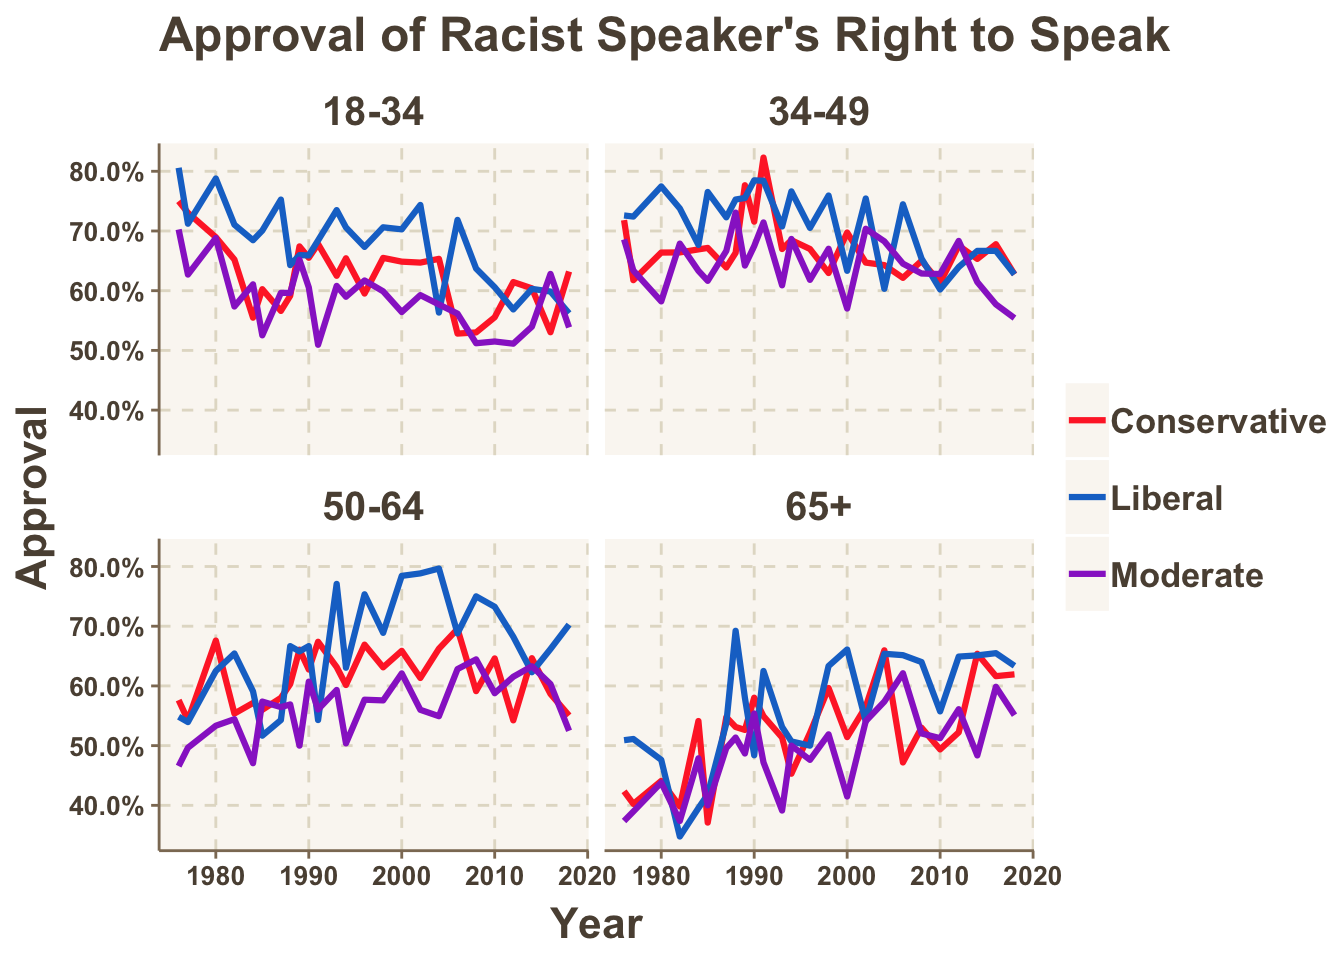
Lack of support for racist speakers is explained by one’s age, not one’s political affiliation. Young people just happen to be liberal at a higher rate. In looking at racist speakers, the younger generations happen to be growing less tolerant of speakers’ rights to spread their ideas. This has been manifested on college campuses which are almost entirely populated by the youngest age bracket.
While this one particular area of free speech is suffering from decreased support from certain age groups, it seems that most other topics aside from racism are as accepted as they’ve ever been among all groups.
Free speech does not appear to be in as much trouble as many believe it to be.